Adult education and training statistics: concepts, data and sources.
Main statistics and indicators on adult learning refer to participation of persons aged 25-64 years in formal and non-formal education and training. Information comes from survey data, now usually using a reference period of 12 months prior to the interview. This is considered to provide a more appropriate measure of participation in adult learning than indicators based on participation in education and training in the last 4 weeks used for monitoring earlier in the 2002-2010 and 2010-2020 policy cycles.
Adult participation in education and training in the EU is measured by two main surveys: the European Labour Force Survey (LFS) and the Adult Education Survey (AES). The LFS traditionally measured participation in the previous 4 weeks, and only since 2022 has it also collected biennial data on participation in the last 12 months. Before that, the AES was the only source providing data for the more comprehensive ‘12 months prior to the survey’ approach, but it is carried out only once every six years. Several methodological differences exist between the two surveys. They are summarised in a previous Cedefop web article and extensively described in more detail in a 2024 Eurostat information note. The most important difference to consider for the purposes of this article is that the AES covers guided on-the-job training as a key part of non-formal learning, while the LFS does not. This accounts for an important difference in the results of both surveys, but even when GOJT is analytically excluded from the production of AES estimates, a significant difference persists due to further methodological differences (Figure 1).
Figure 1: Adults with a learning experience in the last 12 months, LFS and AES data (%). EU-27, 2016, 2022 and 2024

Source:;Eurostat, LFS (trng_lfs_17,access date: 12/03/2026) and AES (trng_aes_100, access date: 12/03/2026) (data excluding guided on the job training supplied at Cedefop request).
AES with the inclusion of guided on-the-job training is considered by Eurostat as the best measure of participation in adult learning in the last 12 months, but EU-level targets were defined using baseline levels derived from the AES data excluding guided on-the-job training. The biennial data from the LFS on participation in the last 12 months also exclude it and can provide additional indication on trends since 2022, but given their recent introduction and the ongoing quality analysis, these data should be interpreted with more caution.
Given this policy and technical context, Cedefop now gives priority to AES data (excluding GOJT) in the European VET policy dashboard and uses a multi-source, multi-indicator approach in the key indicators on VET. In line with this approach, this article checks the status of the policy targets with AES 2022 (excluding GOJT) data when available. At the same time, to enrich the analysis, some LFS data as well as AES data including GOJT are also used.
Participation in adult education and training: rates and trends.
Figure 2 shows European and country-level percentages of adults participating in education and training in the last 12 months in 2016 and 2022. It uses AES data, available every six years, with estimates derived excluding guided on-the-job training, the same type of data used to obtain baselines and define the main targets for the current policy cycle.
Figure 2: Adults with a learning experience in the last 12 months, AES data excluding GOJT (%). EU-27 and countries, 2016 and 2022

Source: Eurostat, AES (data excluding guided on the job training supplied at Cedefop request). 2022 data for FR, IT and RO are accompanied by a 'b' flag: break in time series, and their values cannot be compared over time with previous ones. 2022 data for FR is also accompanied by a 'p' flag: provisional.
Using this metric, the adult participation rate in education and training for the EU-27 in 2022 was 39.5%. Despite the 2.1 percentage points increase since 2016, this is still 7.5% below the 2025 target (47%). This means that the annual increase derived from the six years between 2016 and 2022 (+0.35 percentage points per year) is not enough to meet the targets when applying a simple linear interpolation into the target years, which results in an expected participation rate of 40.6% in 2025 and of 42.3% in 2030. Here and in following interpolations, this is done by first subtracting the 2016 value to the 2022 value and dividing the result by the number of years between both (six years). Then, this annual percentage points increase is applied to the last value as many times as the years between the year it was taken and the target year.
Great variability exists at country level. Some countries such as Sweden or Hungary have already met and even surpassed the European objectives for 2030. In contrast, some other countries such as Bulgaria and Greece have very low rates and have even seen decreases compared with 2016.
A closer inspection of adult participation in education and training in recent years can be achieved by turning now to the LFS data using a ‘12 months prior to the interview’ reference period. In Figure 3, 2022 and 2024 data from this source are displayed.
Figure 3: Adults with a learning experience in the last 12 months, LFS data (%). EU-27 and countries, 2022 and 2024
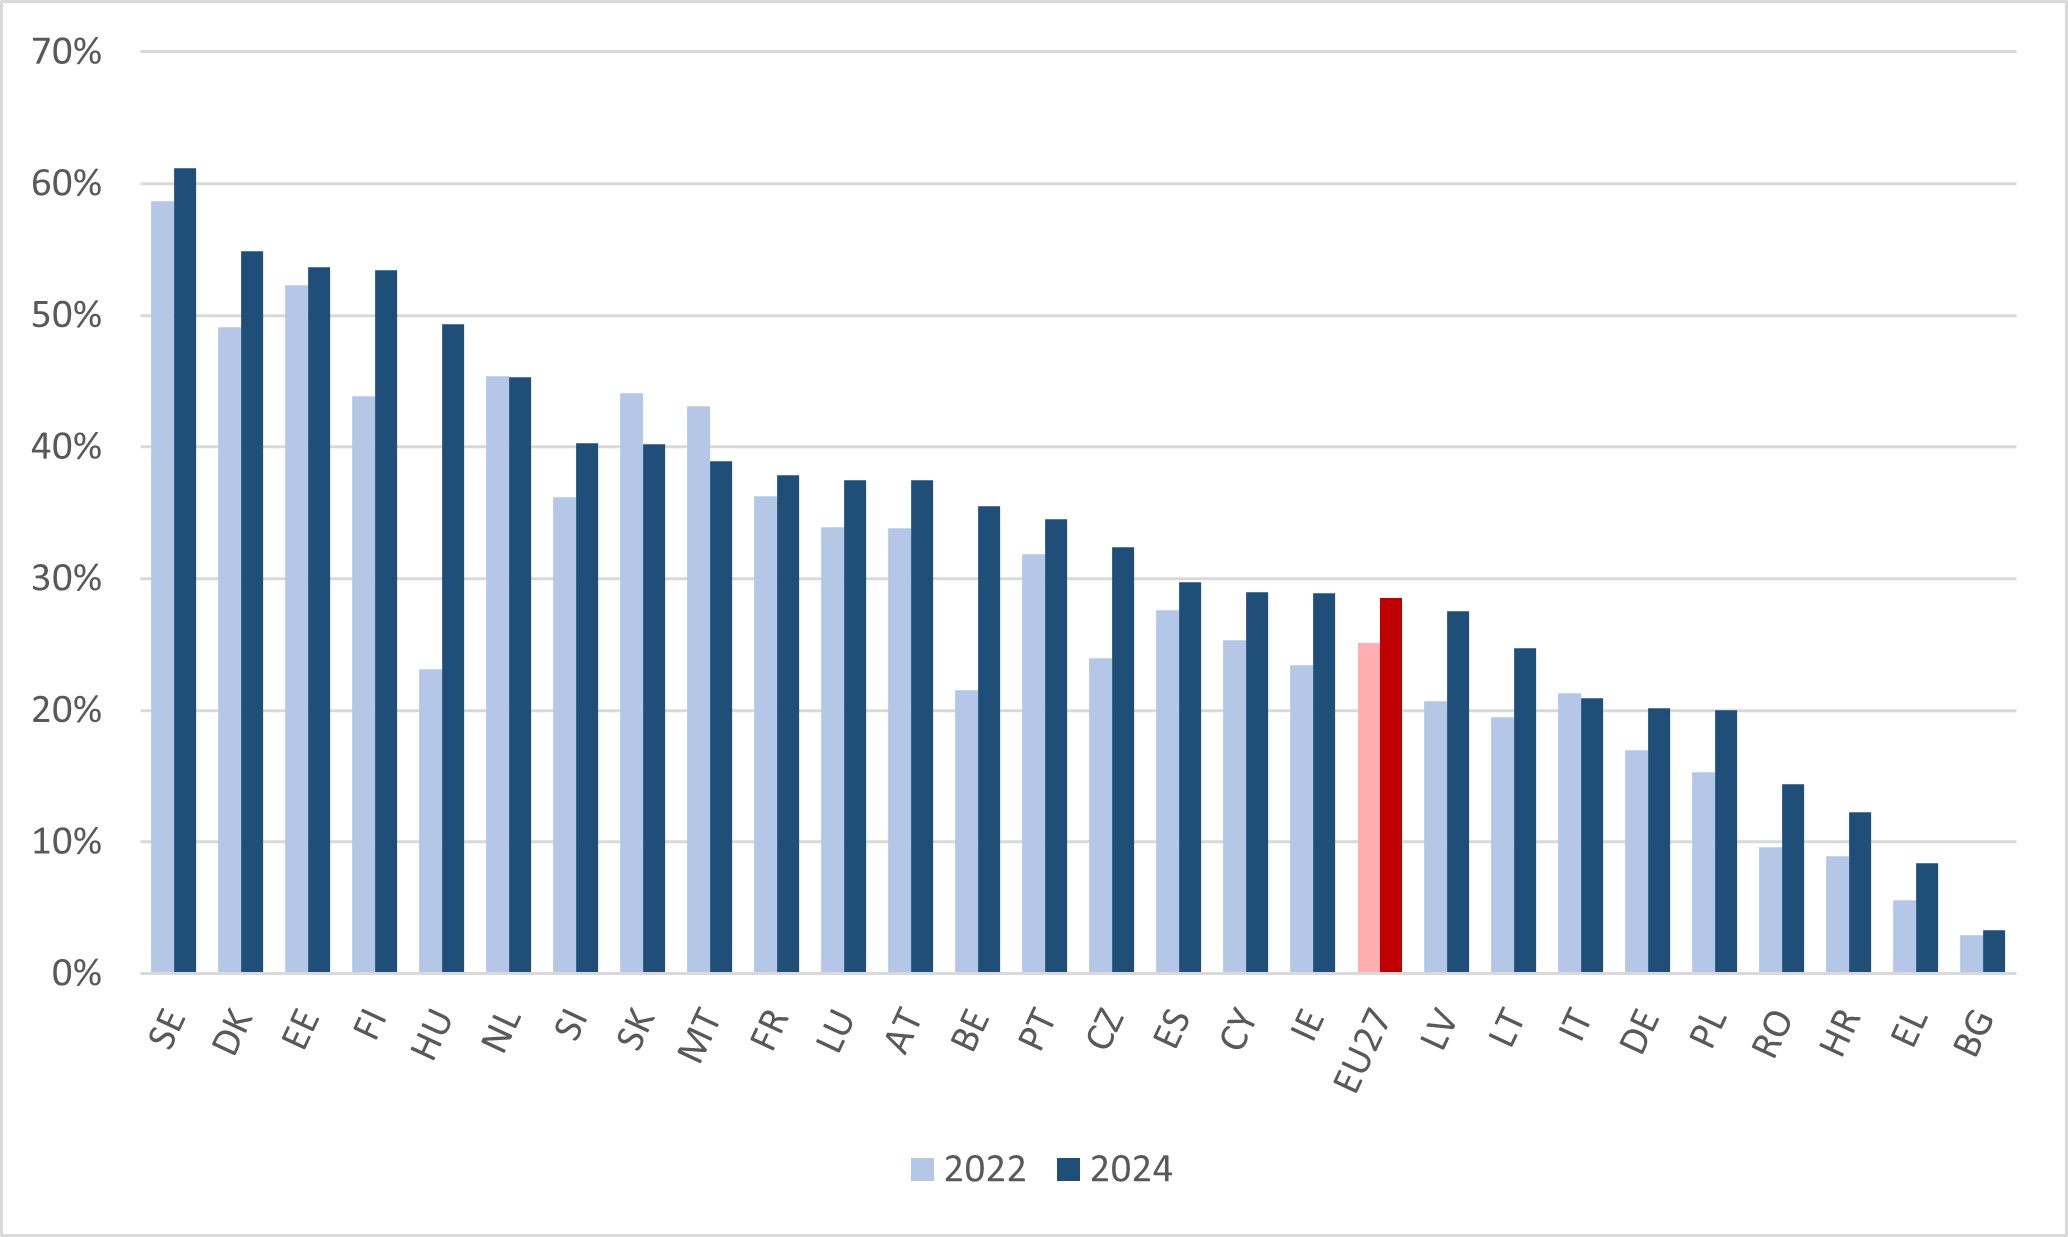
Source: Eurostat, LFS (trng_lfs_17, access date: 12/03/2026). 2024 data for HU. BE, IE, DE and EL are accompanied by a 'b' flag: break in time series, and their values cannot be compared over time with previous ones. 2024 data for MT is accompanied by a 'u' flag: low reliability.
Different methodologies between AES and LFS account for different levels in the participation rates measured by both surveys. The EU average tends to be lower in the latter, which accounts for participation rates of 25.1% in 2022 and 28.5% in 2024 (meaning a 14.4% difference for 2022 EU-27 data). The 2024 LFS data confirm the persistence of considerable cross-country differences and indicate a modest average upward trend in recent years for the EU as a whole. For the EU average, between 2022 and 2024 it is possible to estimate an absolute increase of 3.4 percentage points (as the difference between the 2024 and 2022 values). Among countries for which reliable comparisons can be carried out over time, most of the changes are also positive.
For a broader view of trends in adult participation in education and training over the years, it is also possible to rely on the LFS ‘4 weeks prior to the interview’ variable. Although it is now considered a less precise indicator, it can still provide some information regarding progress over a longer period
Figure 4: Adults with a learning experience in the last 4 weeks, LFS data (%). EU-27, 2015 2024.
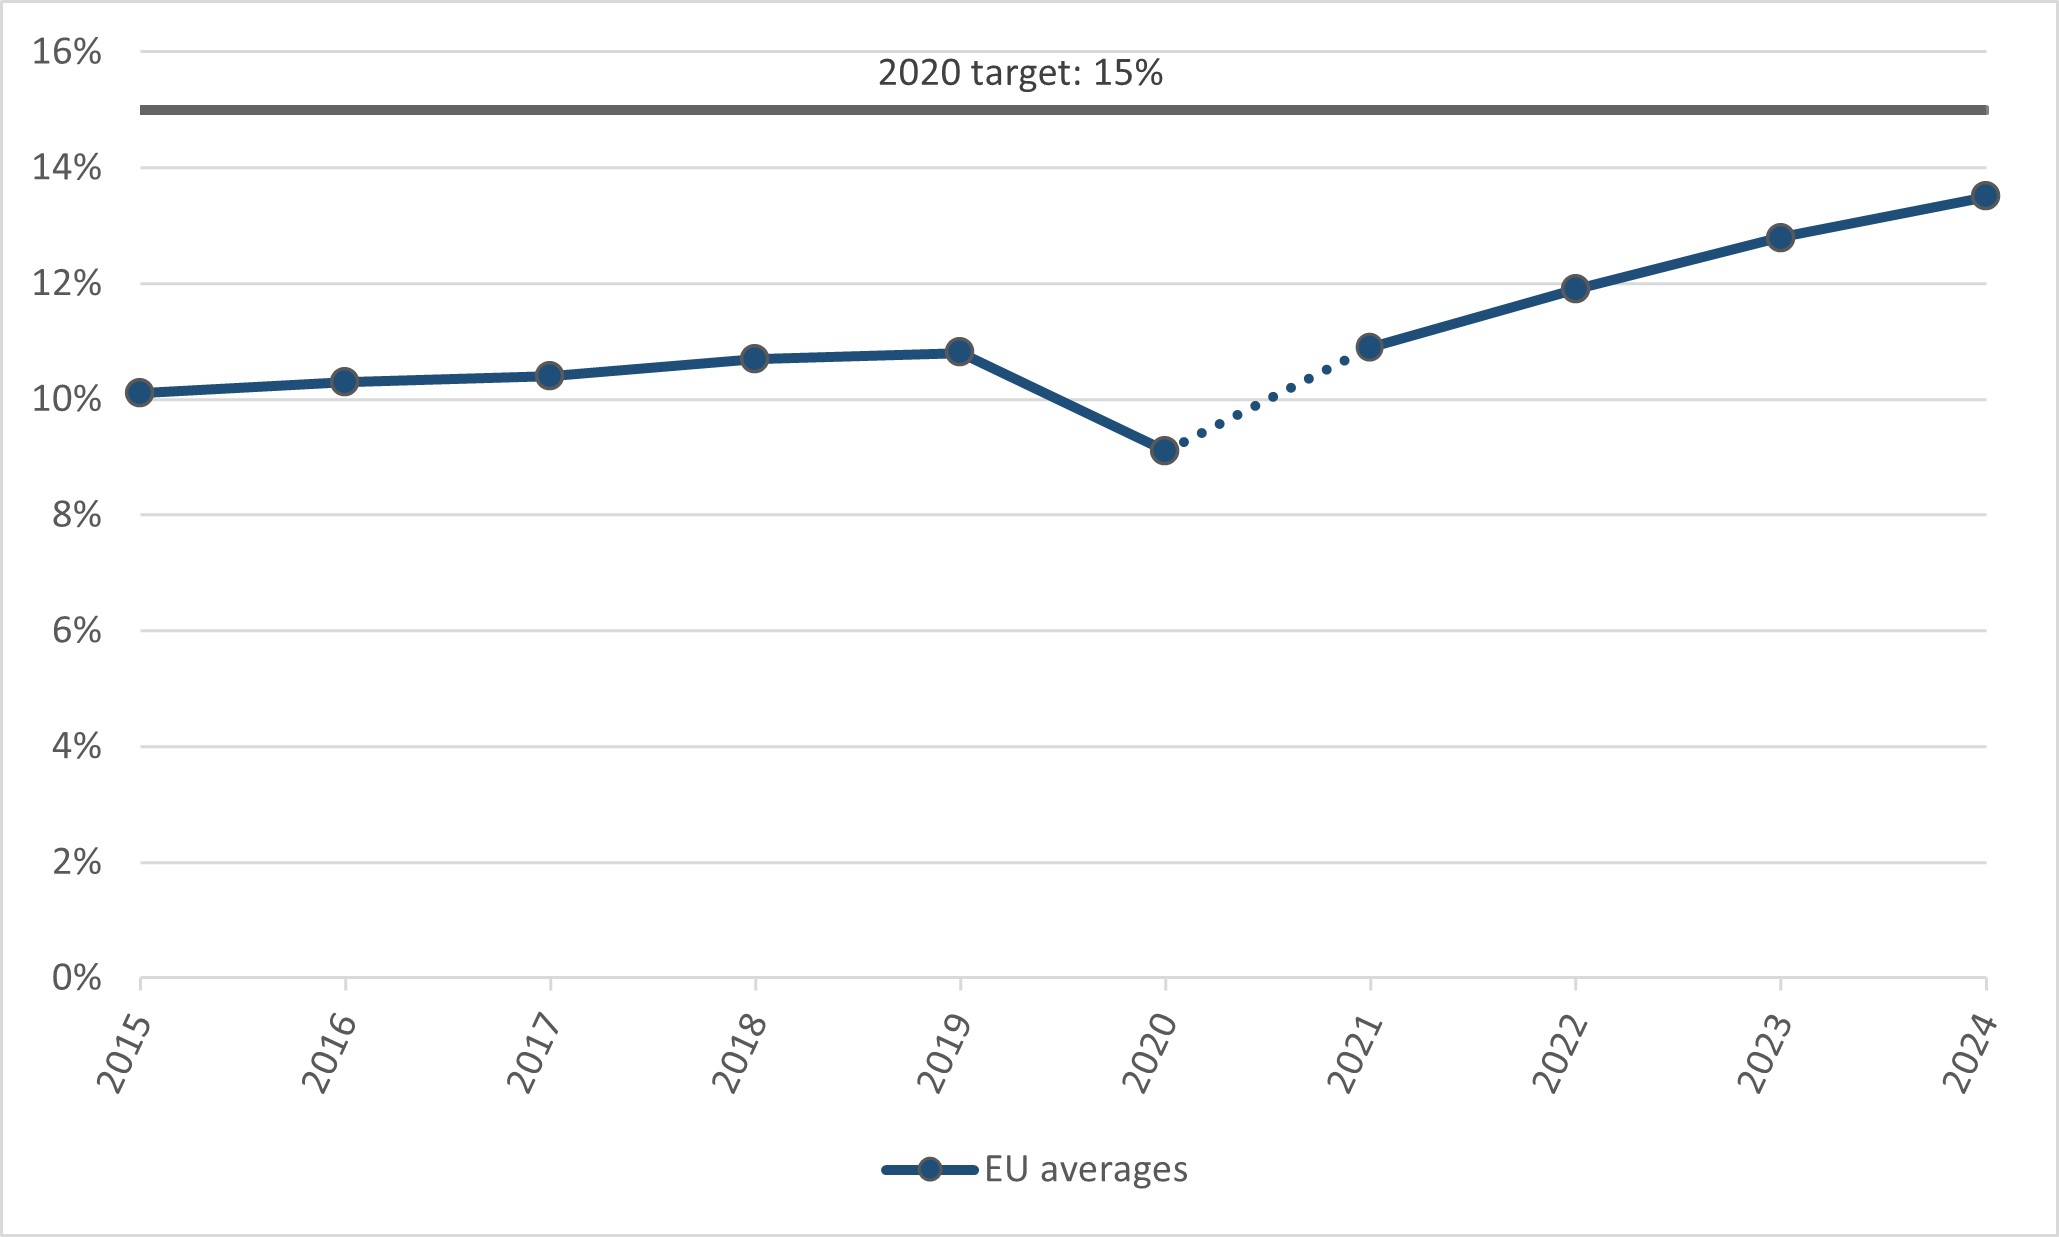
Source: Eurostat, LFS (trng_lfse_01, access date: 12/03/2026). 2021 data for EU27 is accompanied by a 'b' flag: break in time series, and its value cannot be compared over time with previous ones.
IIn the previous policy cycle, this indicator was used to monitor progress towards a target of 15% of adults participating in education and training in the last 4 weeks by 2020 agreed under the European agenda for adult learning. Figure 4 shows that, following years of minor improvements and a drop in 2020 (most probably due to COVID-19 pandemic effects), EU average values for this indicator are now increasing at a more sustained pace towards the 15%. By 2024, the participation rate documented by this approach for the EU-27 was 13.5%. Caution is advised when comparing the pre- and post-2021 data due to a break in time series derived mainly from the introduction of a new IESS Framework Regulation, on which the LFS is based.
Status of the new targets: low qualified and unemployed adults.
The European Skills Agenda introduced two new targets regarding adult education and training with the aims to reach, by 2025, 30% of low-qualified adults participating in adult education and training during the last 12 months and 20% of unemployed adults doing so during the last 4 weeks.
As in the previous section, Figure 5 below prioritises and focuses on 2016 and 2022 AES data excluding GOJT.
Figure 5: Low-qualified adults with a learning experience in the last 12 months, AES data excl. GOJT (%). EU-27 and countries, 2016 and 2022

Source: Eurostat, AES (data excluding guided on‑the‑job training supplied at Cedefop request). 2022 data for FR, IT and RO are accompanied by a 'b' flag: break in time series, and their values cannot be compared over time with previous ones. 2016 data for CZ, EL and HR and 2022 data for DK, SK, LV, SI, CZ, PL and EL are accompanied by a 'u' flag: low reliability. 2016 data for BG, LT, SK and RO and 2022 data for BG, LT and HR are not available.
CCompared with the already discussed participation rates for the whole EU-27 adult population, Figure 5 shows lower values for the group of low-qualified adults (with at most a qualification at ISCED levels 0-2). Using AES data excluding guided on-the-job training for 2022, it is observed that while 39.5% of the whole adult population claimed to have participated in the last 12 months, only 18.4% of low-qualified adults did so. The 2025 target is still 11.6 percentage points away from being reached, and the increase achieved since the previous round of AES six years before is minimal (+0.5 percentage points). At this rate, simple linear interpolation returns an 18.7% participation rate for low-qualified adults in 2025, still 11.4 percentage points below the target.
As with participation rates for the whole adult population, great country-level variability persists in participation rates among low-qualified adults. Country-specific data tend, however, to be more affected by low reliability and breaks in time series.
For a closer inspection of more recent progress, results from LFS can be considered.
Figure 6: Low-qualified adults with a learning experience in the last 12 months, LFS data (%). EU-27 and countries, 2022 and 2024
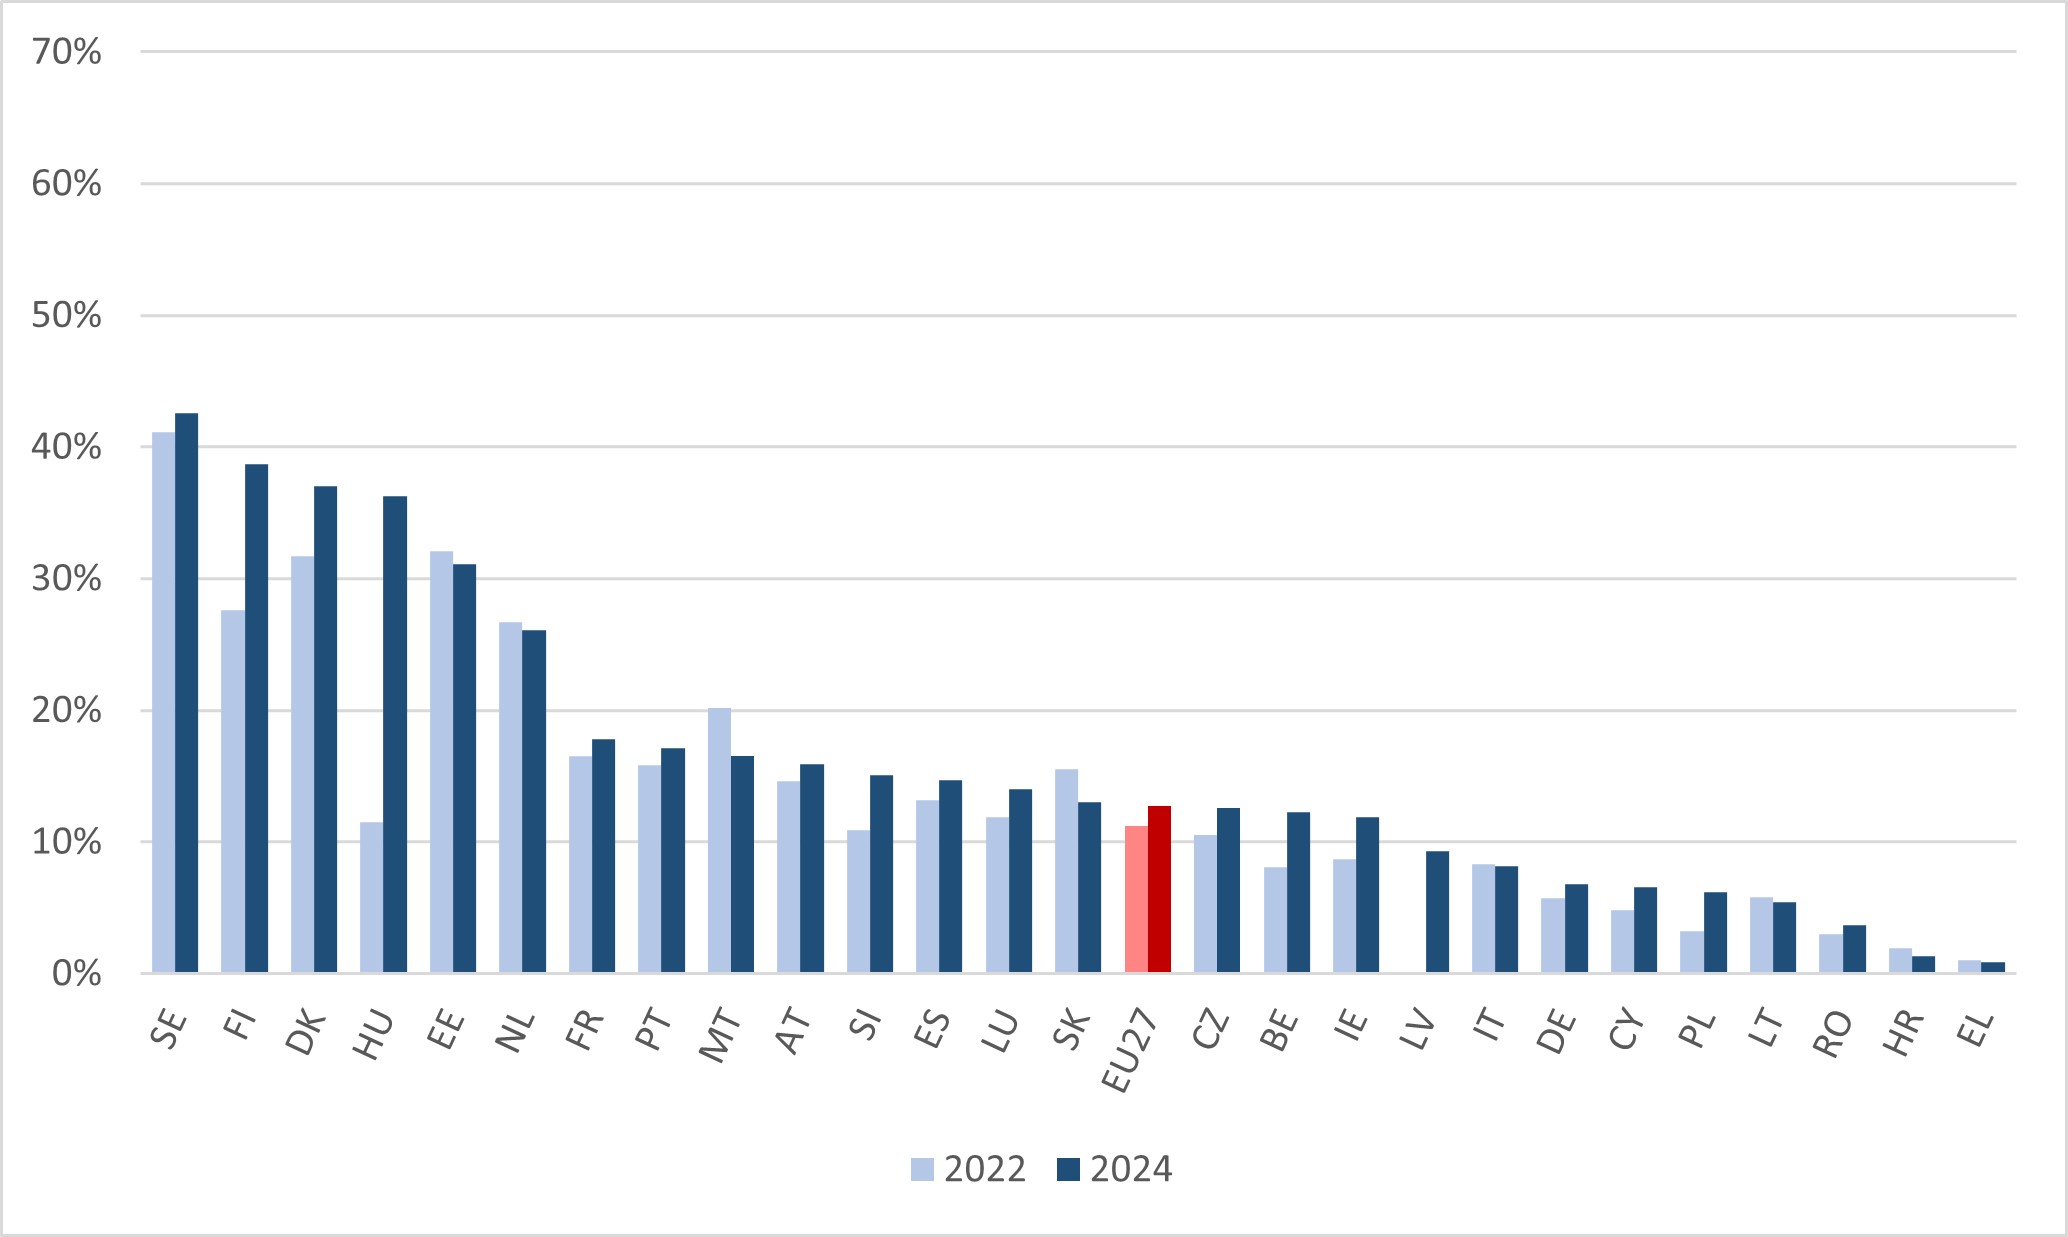
Source: Eurostat, LFS (trng_lfs_18, access date: 12/03/2026). 2024 data for HU. BE, IE, DE and EL are accompanied by a 'b' flag: break in time series, and their values cannot be compared over time with previous ones. 2016 data for FI, SI and HR and 2022 data for FI, MT and HR are accompanied by a 'u' flag: low reliability. 2022 data for LV and BG and 2024 data for BG are not available.
Figure 6 confirms that LFS-based EU estimates tend to be lower than those from AES (even when guided on-the-job training is excluded from the latter), reflecting other methodological differences: in 2022, the EU-27 participation rate for low-qualified adults was 18.4% in AES and 11.2% in LFS. Figure 6 is nonetheless helpful in that it shows progress in the very last years.
Most countries have recently experienced increases in the participation rates of low-qualified adults. The average EU-27 value has gone up to 12.7% in 2024, corresponding to an increase of 1.5 percentage points since 2022.
When monitoring unemployed adults’ participation in education and training, the reference period of ‘4 weeks prior to the interview’ is considered more in line with the labour market concept of unemployment status. LFS is consequently the preferred reference source to consider.
Figure 7. Unemployed adults with a learning experience in the last 4 weeks, LFS data (%). EU-27 and countries, 2022 and 2024.
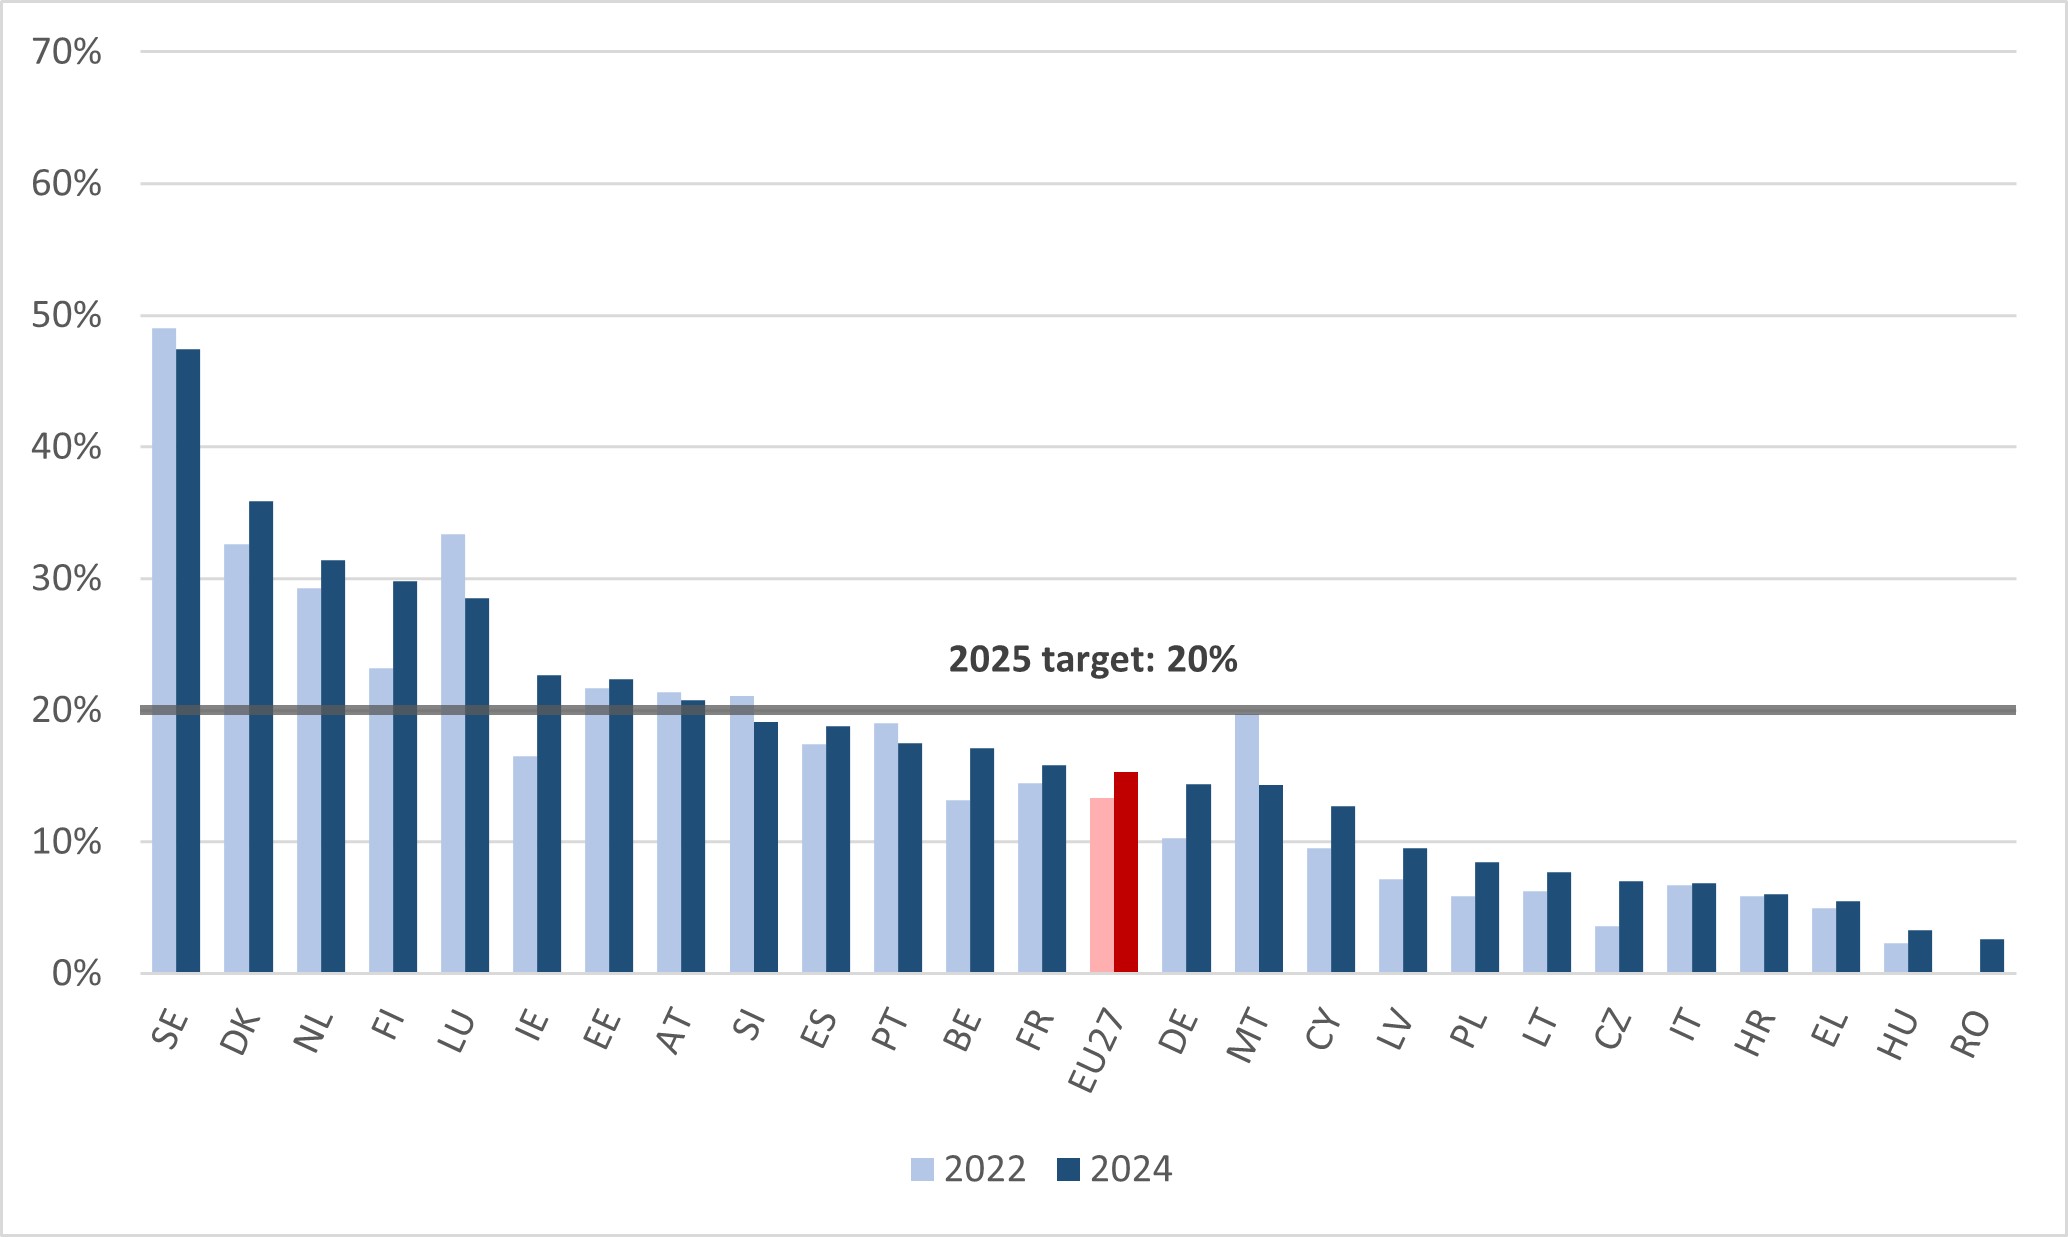
Source: Eurostat, LFS (trng_lfse_02, access date: 12/03/2026). 2024 data for IE, BE, DE and EL are accompanied by a 'b' flag: break in time series, and their values cannot be compared over time with previous ones. 2022 and 2024 data for ES and FR are accompanied by a 'd' flag: definition differs. 2022 data for LU and HR and 2024 data for MT, HR and RO are accompanied by a 'u' flag: low reliability. 2022 data for RO, BG and SK and 2024 data for BG and SK are not available
Figure 7 shows 2022 and 2024 participation rates of unemployed adults in the EU-27 and at country level. The participation rate for EU-27’s unemployed adults was 13.3% in 2022 and 15.3% in 2024, accounting for a 2 percentage points increase in two years.
Even though the 2025 EU target is unlikely to be met at the current pace, these results indicate that, following years of modest improvements, EU average values for this indicator are increasing at a more sustained pace and show better progress. This is clear when looking at the longer period trend for both low-qualified and unemployed adults as shown in Figure 8.
Figure 8. Recent (last 4 weeks) adult learning participation among low qualified and unemployed adults, LFS data (%). EU-27, 2015 2024.
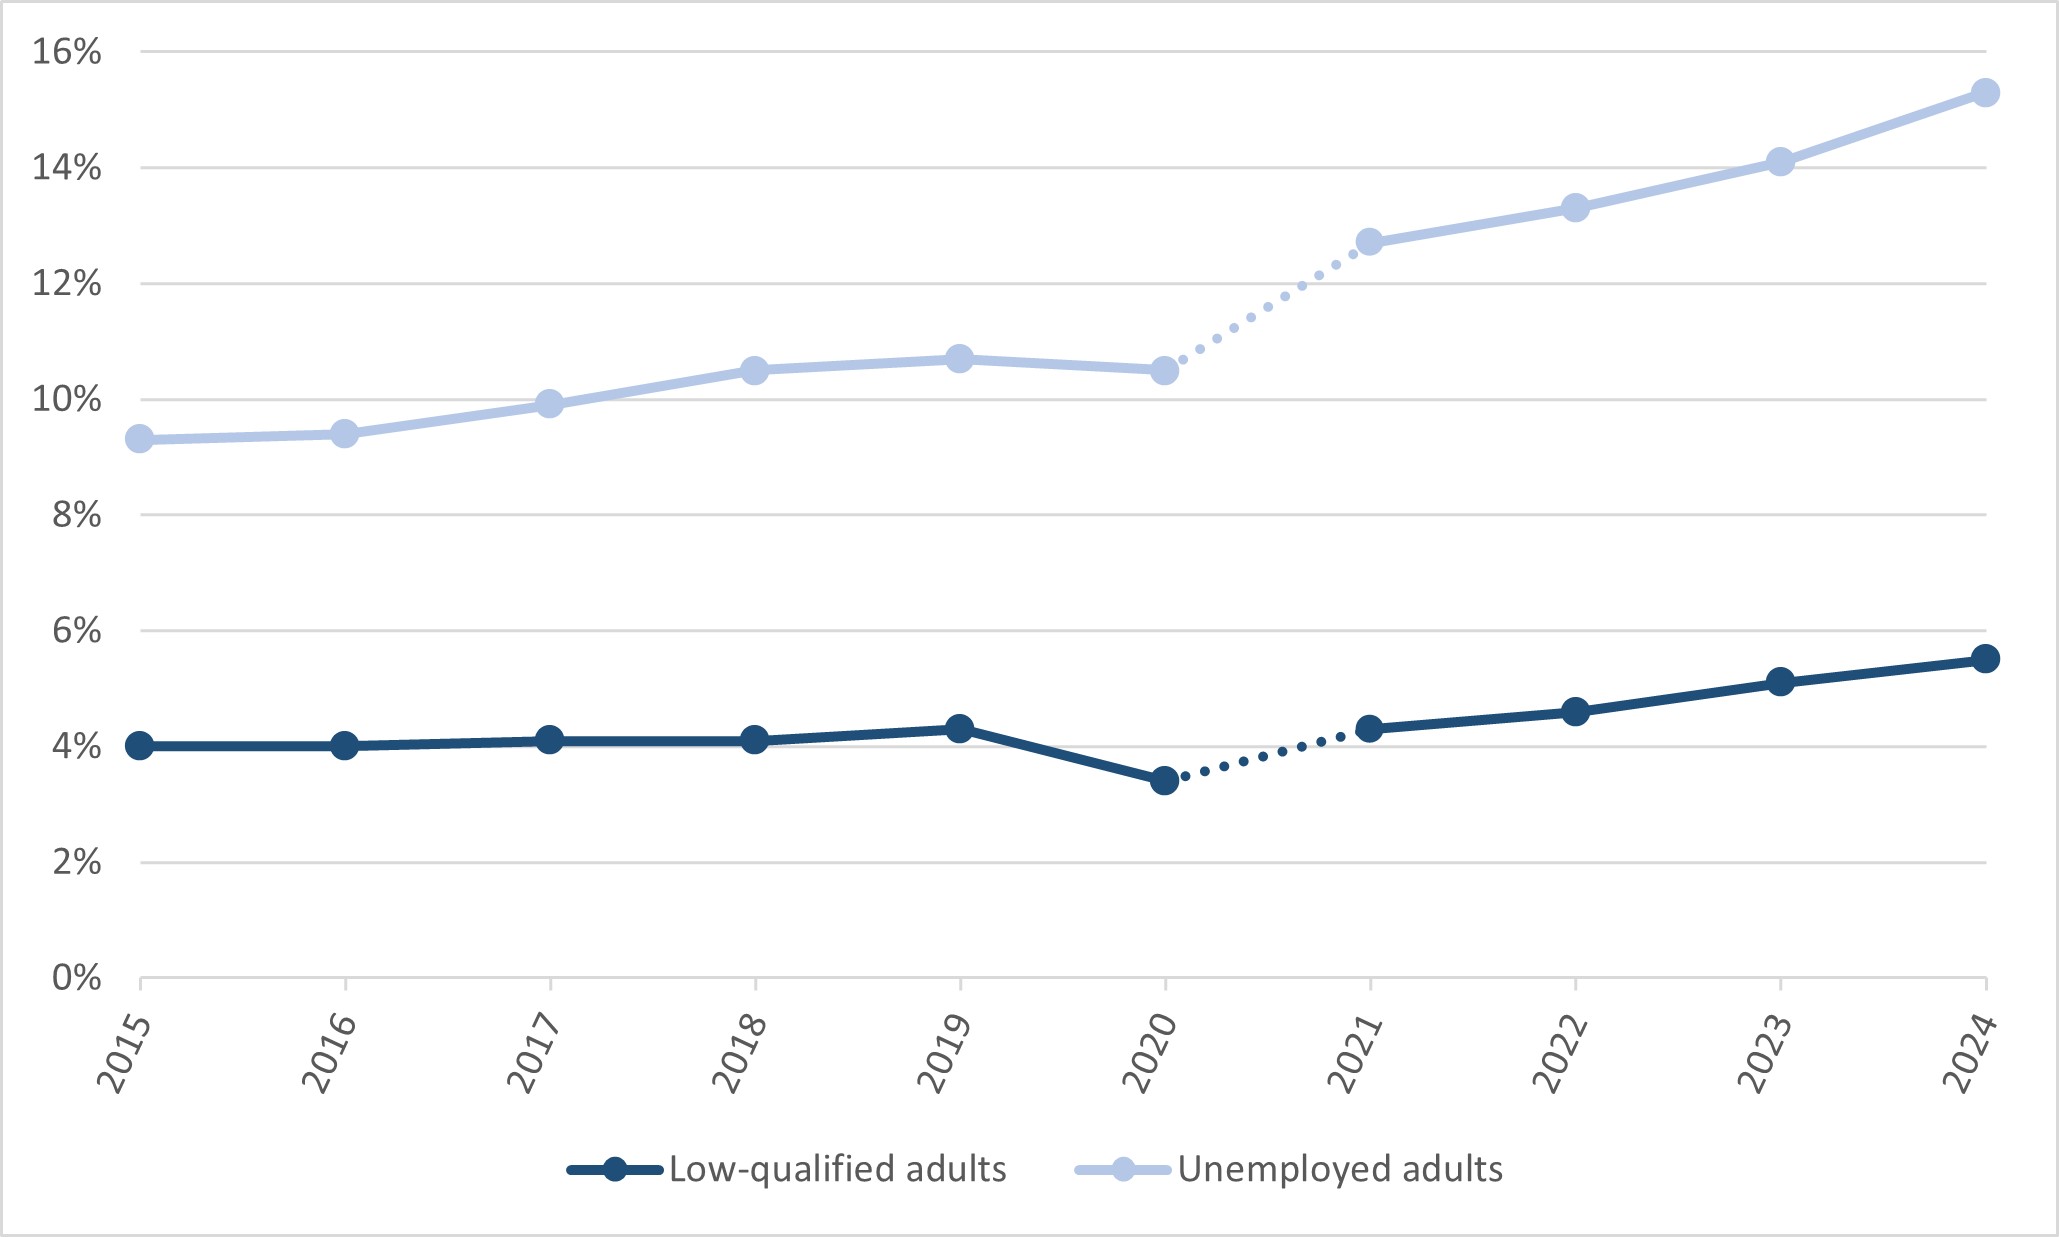
Source: Eurostat, LFS (trng_lfse_03, access date: 12/03/2026 & trng_lfse_02, access date: 12/03/2026). 2021 data for EU27 are accompanied by a 'b' flag: break in time series, and their values cannot be compared over time with previous ones.
Here, the most promising evolution is depicted in the participation rates of unemployed adults. Although there is an important break in the time series in 2021, there is still a visible change of pace in the latest rate increases, with a 2.6 percentage points increase from 2021 to 2024. Recent increases in participation rates of low-qualified adults have been overall smaller, with a difference of +1.2 percentage points between 2021 and 2024.
LFS data show that, regardless of the possible overlaps of both sub-groups of the adult population in EU-27, unemployed adults were in 2024 almost three times more likely to participate in education and training in the 4 weeks prior to the survey than low-qualified adults, with participation rates of 15.3% and 5.5% respectively.
Other important aspects of participation rates.
These last findings point to the importance of a deeper understanding of the dynamics involved in the participation of adults in education and training. To this end, it is worth looking into participation rates for other relevant sub-groups of adults, even when no target is set for them. This section is dedicated to the analysis of different aspects that can account for crucial differences in the way participation rates vary among the population. This can not only point at pertinent categories for understanding the topic of interest but suggest leverage points for a more informed tackling of the challenges ahead.
Since the monitoring of targets is not the main goal now, it is possible to use AES including GOJT data as the main reference. This allows users to take advantage of the full potential of the survey. Guided on-the-job training is an essential part of adult education and training and including it can result in a more precise picture, which might be useful for policy design and implementation.
This section turns the attention to participation rates in the AES including GOJT data when disaggregated by sex, age, educational attainment, labour status, occupation and degree of urbanisation of the area of usual residence of the respondents. Apart from showing differences across socio-demographic groups and checking their absolute changes between the two last AES rounds (as the difference between 2022 and 2016 values), it includes relative changes (as absolute changes divided by the value of the baseline year, 2016) as an additional point of reference using a secondary axis in the charts.
Figure 9. Participation rate in adult education and training by sex, AES data incl. GOJT (%). EU-27, 2016 and 2022.
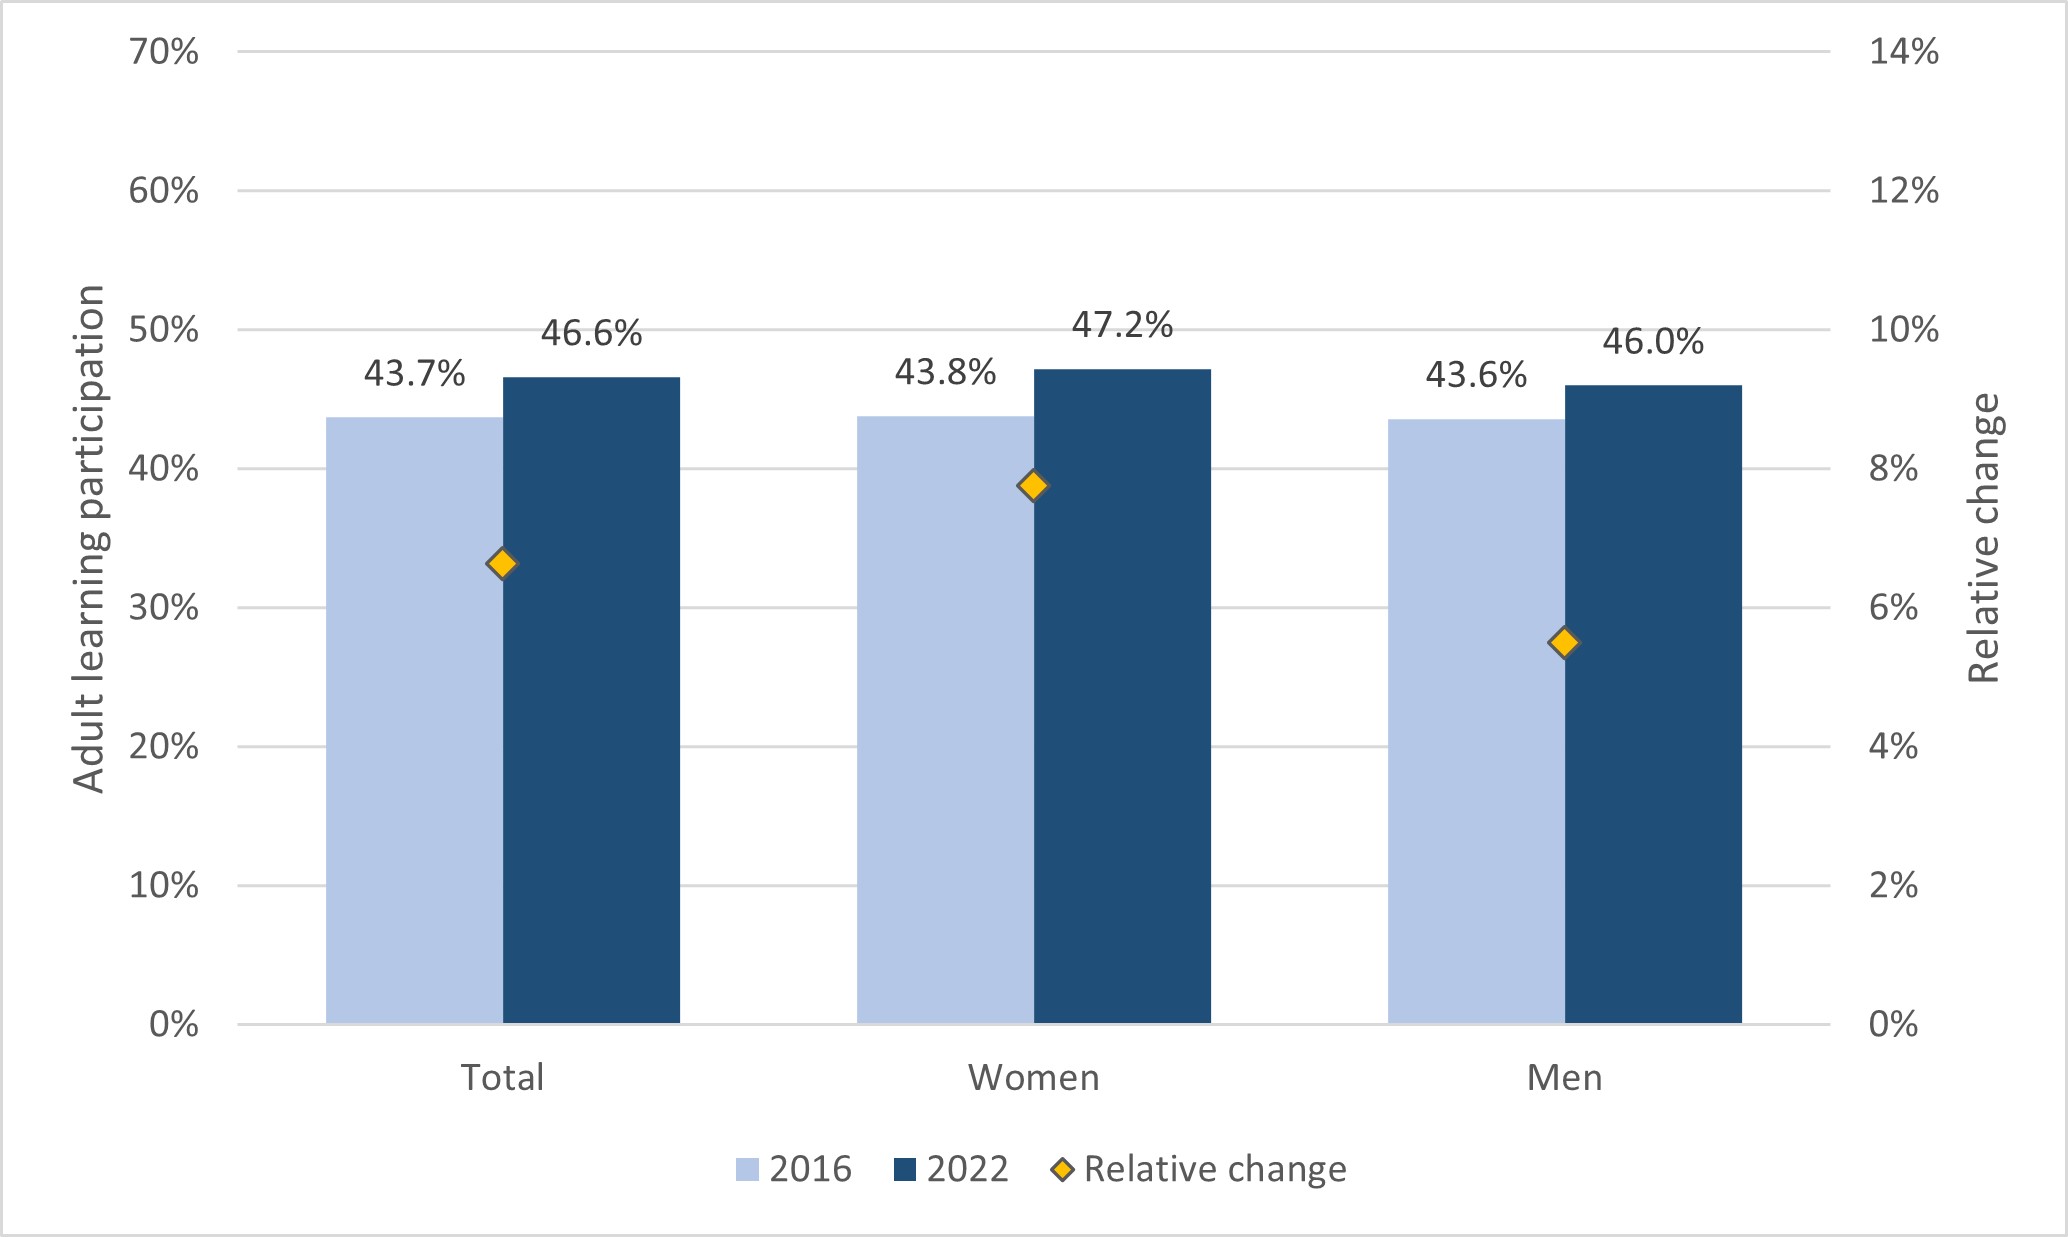
Source: Eurostat, AES (trng_aes_100, access date: 12/03/2026).
Figure 9 shows the participation rates of adults and adults by sex in 2016 and 2022, as well as their relative change percentage over those six years. As it is clear from the chart, no major differences are found in the participation between men and women based on EU-27 average estimates from the last two AES rounds. Men and women had very similar participation rates in adult education and training in 2016 (43.6% and 43.8% respectively). Compared with 2016, in 2022 participation rates went up for both genders, the increase for women being slightly larger than the one for their male counterparts, resulting in rates of 46% for men and 47.2% for women. However, the gender dimension does relate to some differences in the perceived obstacles to participation (see next section).
Figure 10. Participation rate in adult education and training by age groups, AES data incl. GOJT (%). EU-27, 2016 and 2022.
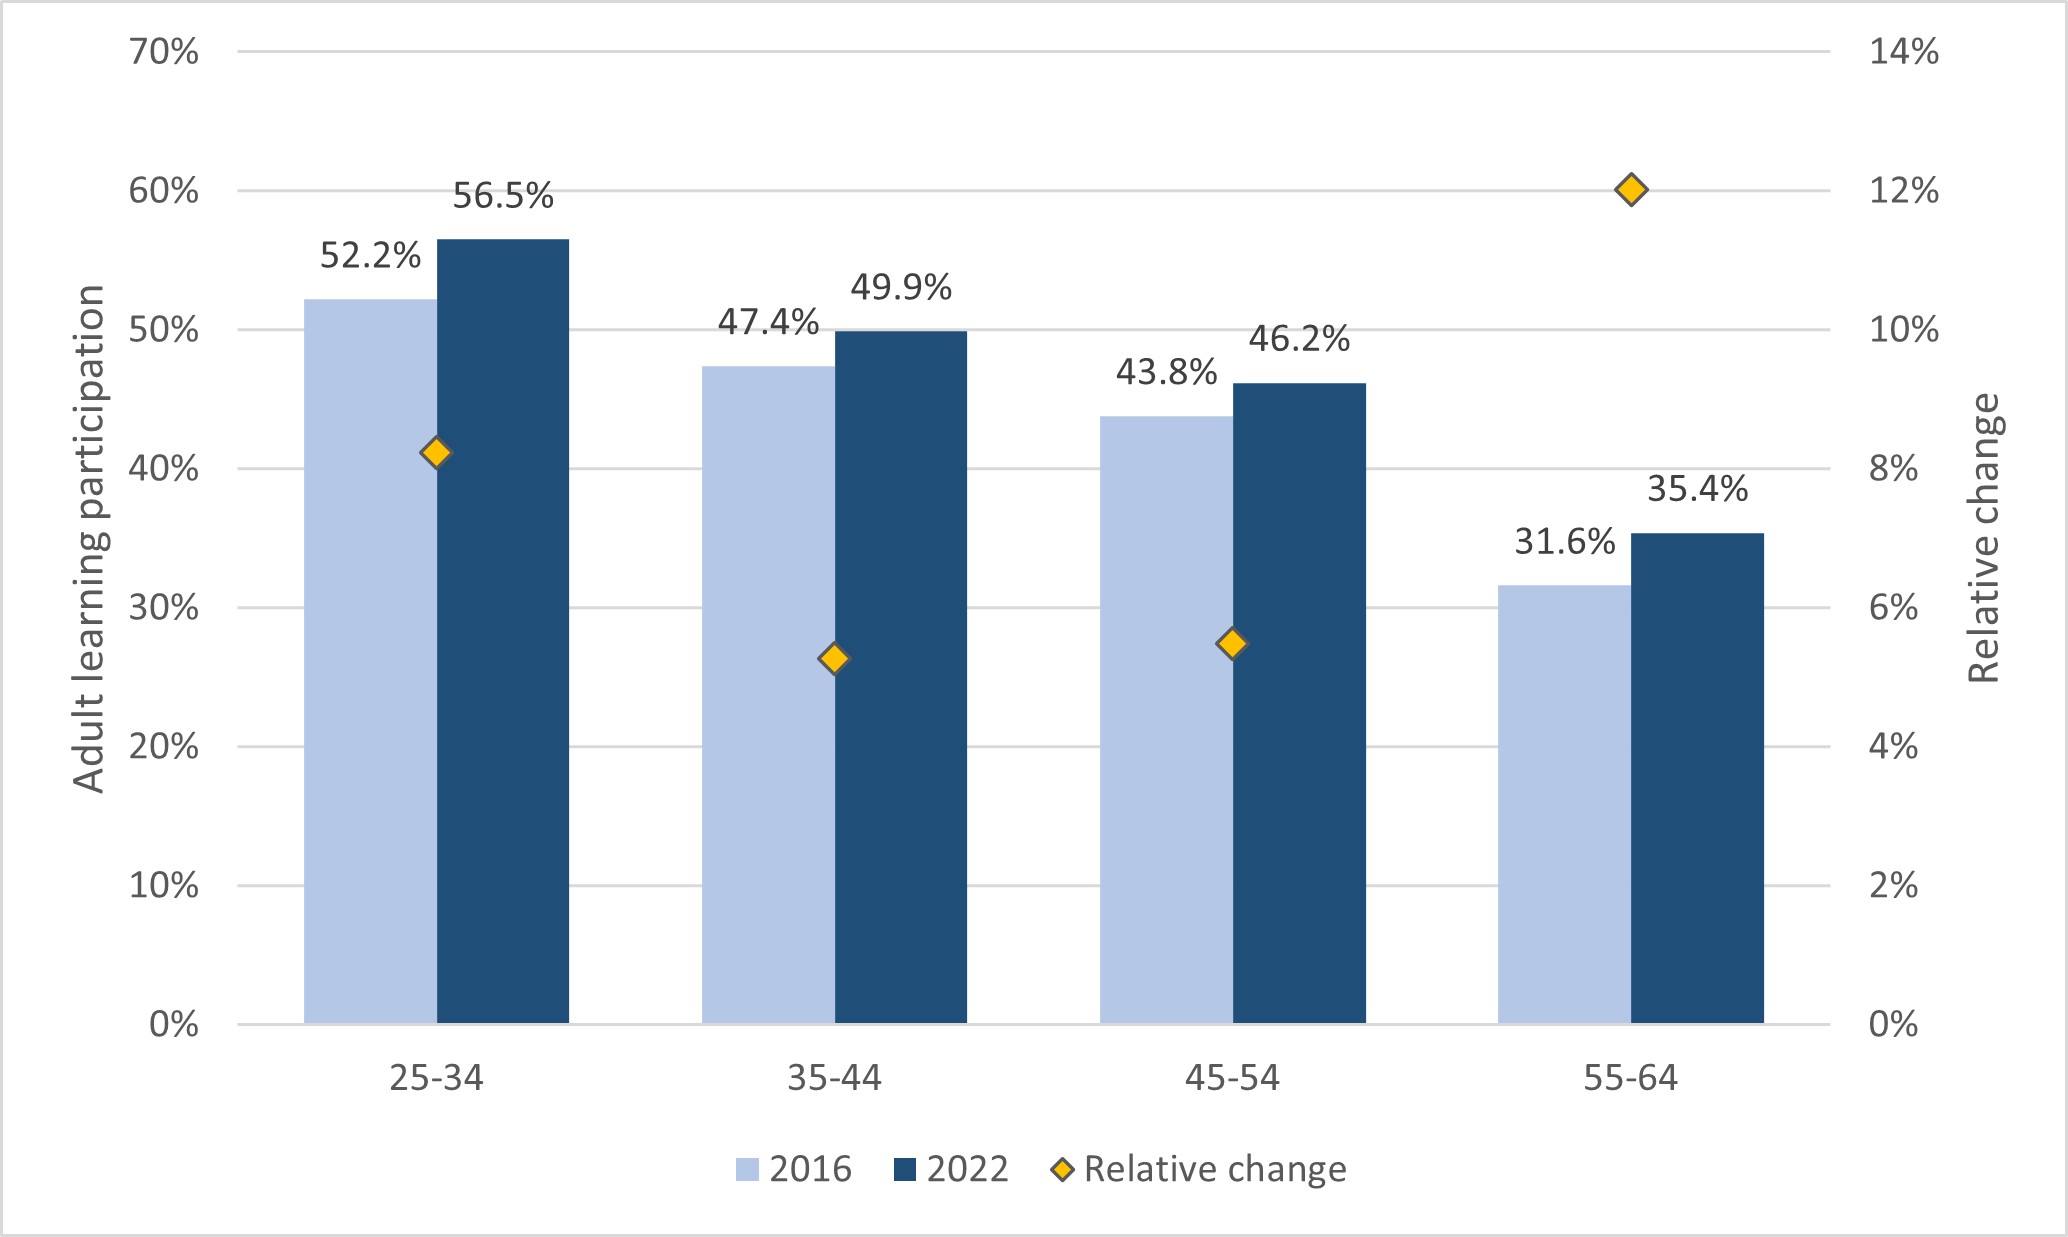
Source: Eurostat, AES (trng_aes_101, access date: 12/03/2026).
Figure 10 presents the same kind of analysis with participation rates disaggregated by age. In this case, there is a visible relation in which participation in education and training becomes less common among older groups. AES data show that in the six years between the last two surveys (2016-2022) every age group has experienced an increase in its participation in adult education and training. The 25-34 years old group is the one with the greatest absolute increase (+4.3 percentage points) and the 55-64 years old group the one with the greatest relative increase (+12%). Still, major differences by age persist, with the 55-64 year-olds participating the least. Statistically speaking, for every adult in the 55-64 age range participating in education and training in 2022 there were almost 1.6 adults in the 25-34 age range doing the same. This leads to concern because, as already mentioned, workers aged over 55 are increasing in number faster than other age groups and need to adapt more to new technological advances.
Figure 11. Participation rate in adult education and training by highest level of education attained, AES data incl. GOJT (%). EU-27, 2016 and 2022.

Source: Eurostat, AES (trng_aes_102, access date: 12/03/2026).
The biggest differences among the analysed categories of adults can be found when grouping by highest level of educational attainment (Figure 11). Low-qualified adults (that is, adults with at most a qualification at ISCED levels 0-2 as their highest) had a participation rate of 25.1% in 2022, considerably lower than the 41.5% average for adults with a medium level of education (that is, those with at most a qualification at ISCED levels 3-4) and the 65.7% for adults with a qualification at tertiary level (that is, ISCED levels 5 to 8). This means that highly-qualified adults were, in 2022, more than twice as likely to participate in education and training as low-qualified adults. However, low-qualified adults were also the group that experienced the largest increase since 2016, both in absolute (+2.2 percentage points) and in relative terms (+9.6%).
In the second group (ISCED levels 3-4), which clusters adults with upper secondary and post-secondary non-tertiary education, 2022 AES data allow a distinction between those with general and vocational orientation. In 2022, in the EU-27, adults with medium-level vocational qualifications as their highest had a participation rate in adult education and training slightly lower than their counterparts with general education at the same ISCED level, with a negative difference of 3.4 percentage points (40.7% and 44.1% respectively).
Figure 12. Participation rate in adult education and training by main labour market status, AES data incl. GOJT (%). EU-27, 2016 and 2022.

Source: Eurostat, AES (trng_aes_103, access date: 12/03/2026).
Figure 12 displays participation rates by main labour market status according to AES data including GOJT. Employed adults clearly emerge as those with higher participation rates in adult education and training. In 2022 the rates were 53.9% for employed adults compared with 29.2% for unemployed adults and 24.4% for inactive ones. In this case, the chances that an employed adult had participated in education and training in the 12 months prior to the interview were more than double with respect to inactive adults but not with respect to unemployed ones. Still, it could be said that every unemployed participant accounted for 1.85 employed participants. To an extent, this also relates to the importance of GOJT, which is easier for employed adults to access. Unemployed adults had a 27.8% participation rate in 2016 and experienced an increase of 1.4 percentage points between 2016 and 2022 as measured by AES data including GOJT. This corresponds to a 5% relative increase in six years, still below the 10.4% relative change experienced by the otherwise less participative inactive adult population.
Figure 13. Participation rate in adult education and training by occupation groups, AES data incl. GOJT (%). EU-27, 2016 and 2022.

Source: Eurostat, AES (trng_aes_104, access date: 12/03/2026).
Participation rates can seem overall higher when dividing the adult population by occupation groups, probably due to the absence of some adults who were part of the less participative groups of inactive and unemployed adults (those not previously employed who could not be classified in a specific category). However, there are still important differences to consider between groups of occupations (Figure 13). The group of managers, professionals, technicians and associate professionals had a participation rate of 68.7% in 2022 and clearly clusters the adults who participate the most in education and training.
Adults with such occupations were more than twice as likely to participate than adults with elementary occupations, who reached a participation rate of 31.5% in the same year. Skilled manual workers and clerical support workers, service and sales workers occupied a middle-ground position between the other two groups and had participation rates of 36.7% and 48.1% respectively. Absolute and relative increases since 2016 were generally small.
Figure 14. Participation rate in adult education and training by degree of urbanisation of the area of usual residence, AES data incl. GOJT (%). EU-27, 2016 and 2022.
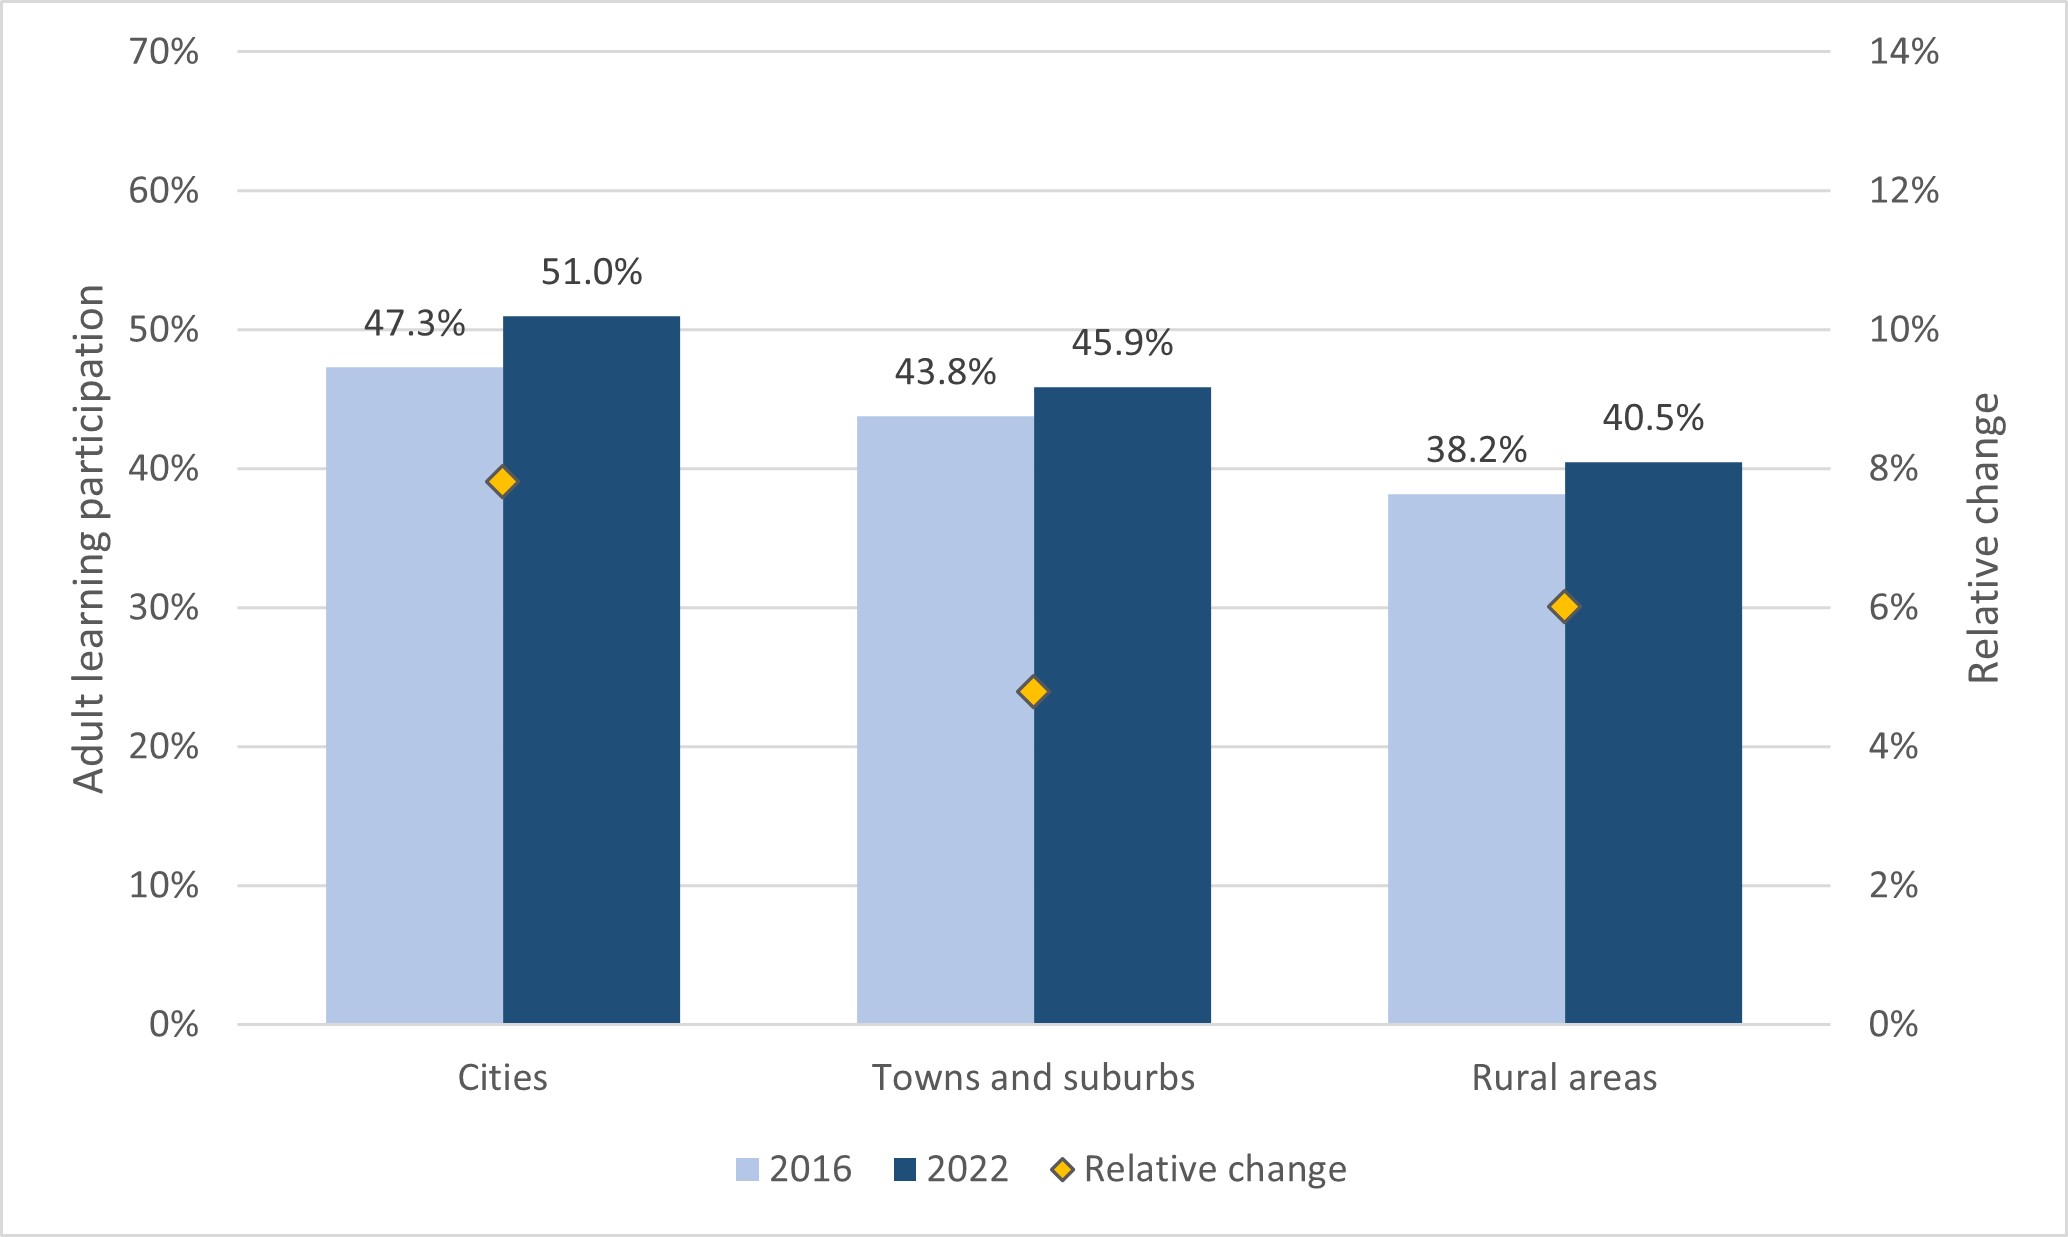
Source: Eurostat, AES (trng_aes_105, access date: 12/03/2026).
The degree of urbanisation of the area where adults usually live is the last dimension considered in this section. Figure 14 shows that adults living in more urbanised areas tend to participate more than those living in less urbanised areas. Adults living in cities are both those participating more and those whose participation increased more in the six years between the last two AES, both in absolute and in relative terms. In 2022, rural areas had a participation rate in adult education and training of 40.5% and cities one of 51%, which means that adults living in cities were around 25% more likely to participate than adults living in rural areas.
Obstacles, barriers and reasons for not participating.
This last section focuses on data for a better understanding of the reasons for participating or not participating in education and training.
Figure 15. Adult population by participation in education and training in the last 12 months and by desire to participate/participate more, AES data incl. GOJT (%). EU-27, 2022.
Source: Eurostat, AES (trng_aes_175, access date: 12/03/2026).
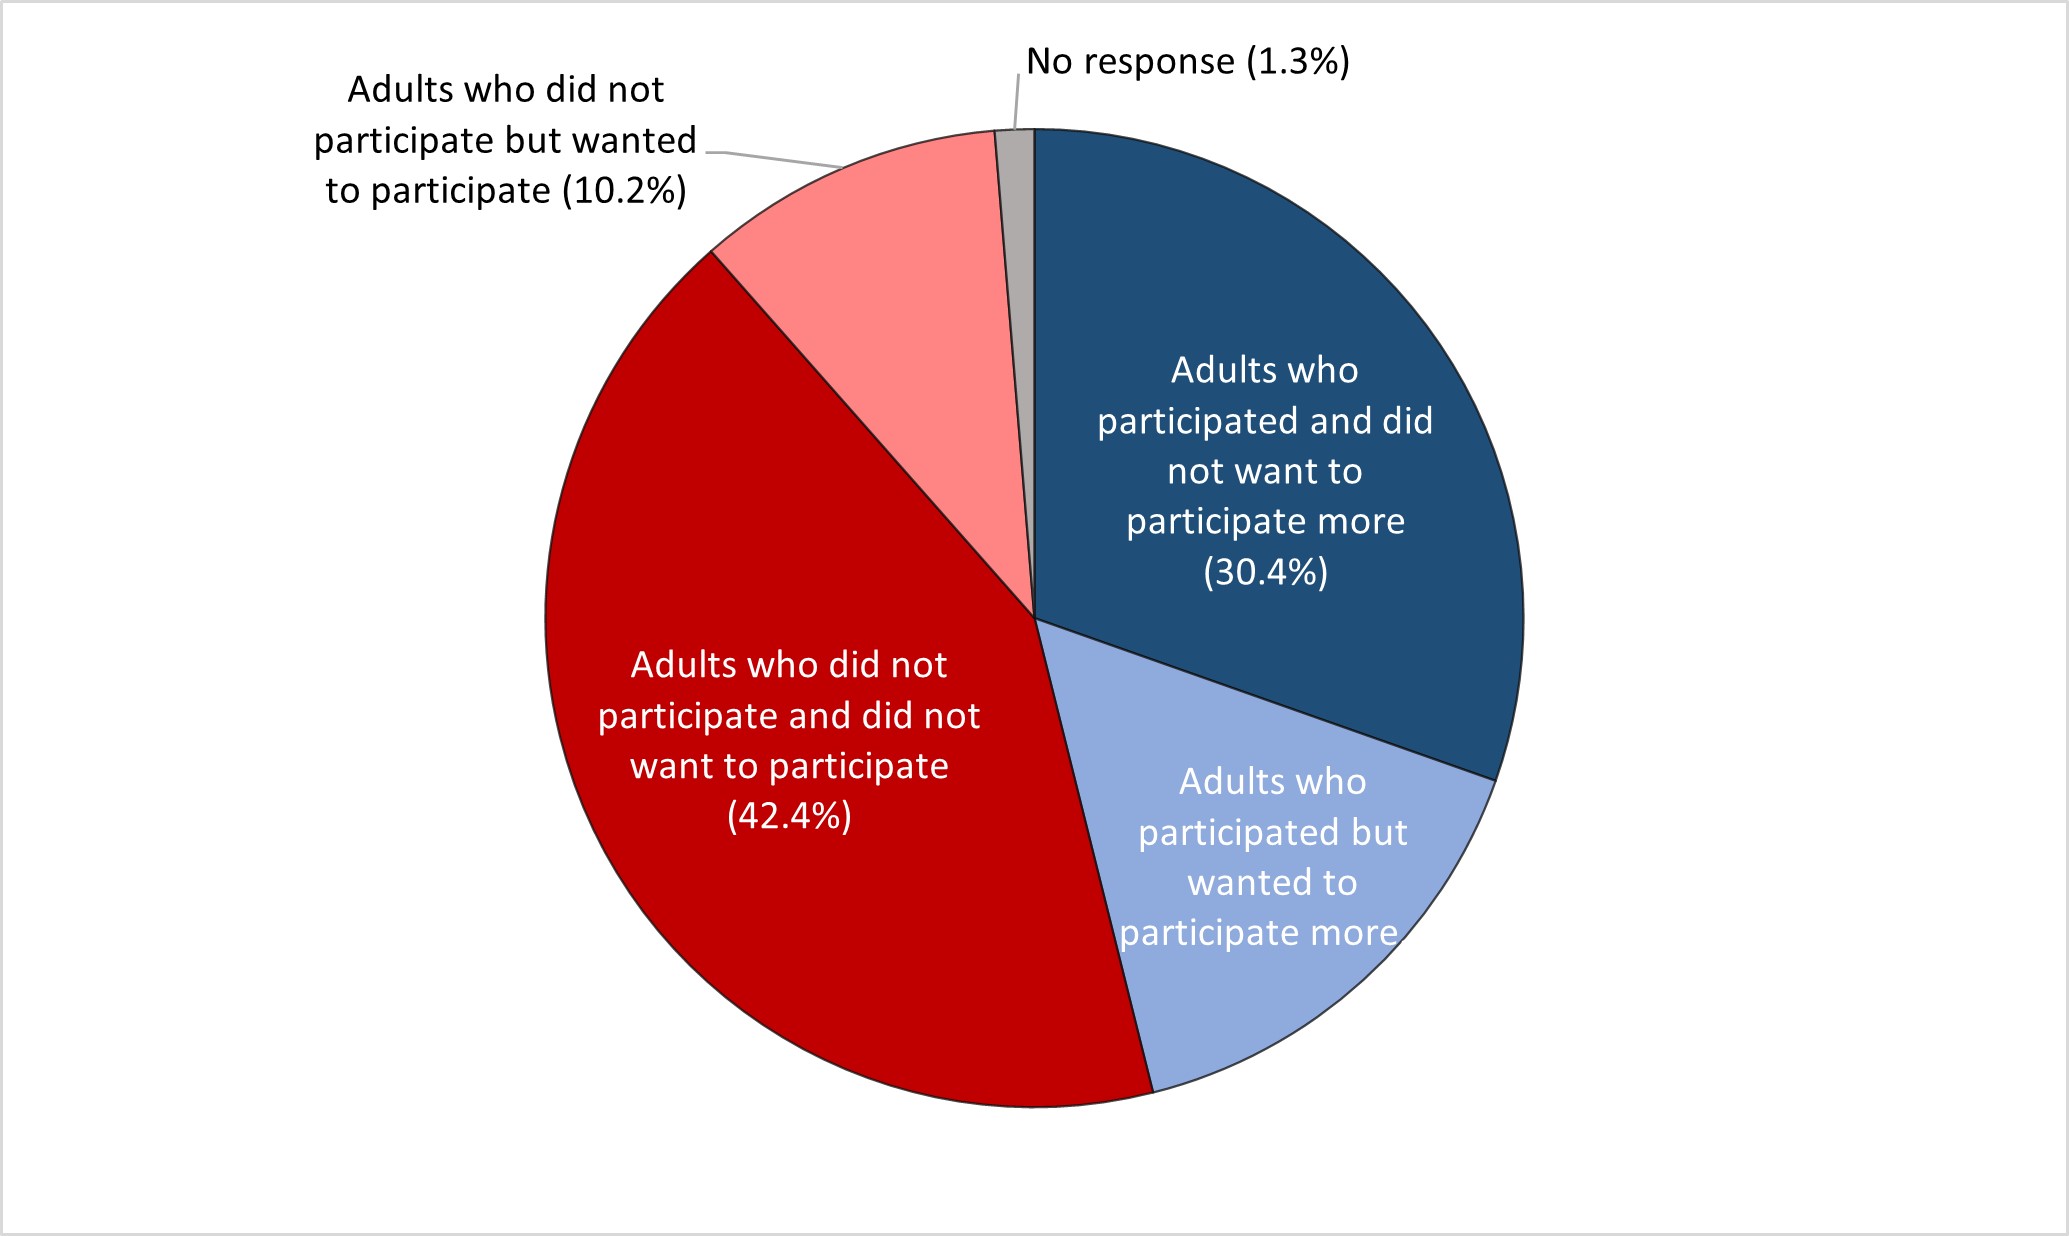
AES allows the clustering of the European adult population into four different groups according to their participation and desire to participate in education and training (Figure 15). In 2022, the largest group was adults who did not participate and did not want to participate in education and training, accounting for 42.4% of the whole adult population. The second-largest group consisted of adults who participated and did not want to participate more in education and training (30.4%). Only 10.2% did not participate but wanted to do so and 15.7% participated and wanted to participate more. This may be due to a selection bias by which the group of adults who participate tends to include those more inclined to participate again, but it may also indicate that taking part in education and training, even in short programmes, drives greater interest in continuing that involvement.
One reason behind the prominence of adults who do not participate and state that they do not want to do so could be that they perceive education and training as involving certain obstacles or inconveniences. Further exploration of the data is needed here, including to understand the obstacles faced by adults who state that they want to participate but still refrain from doing so.
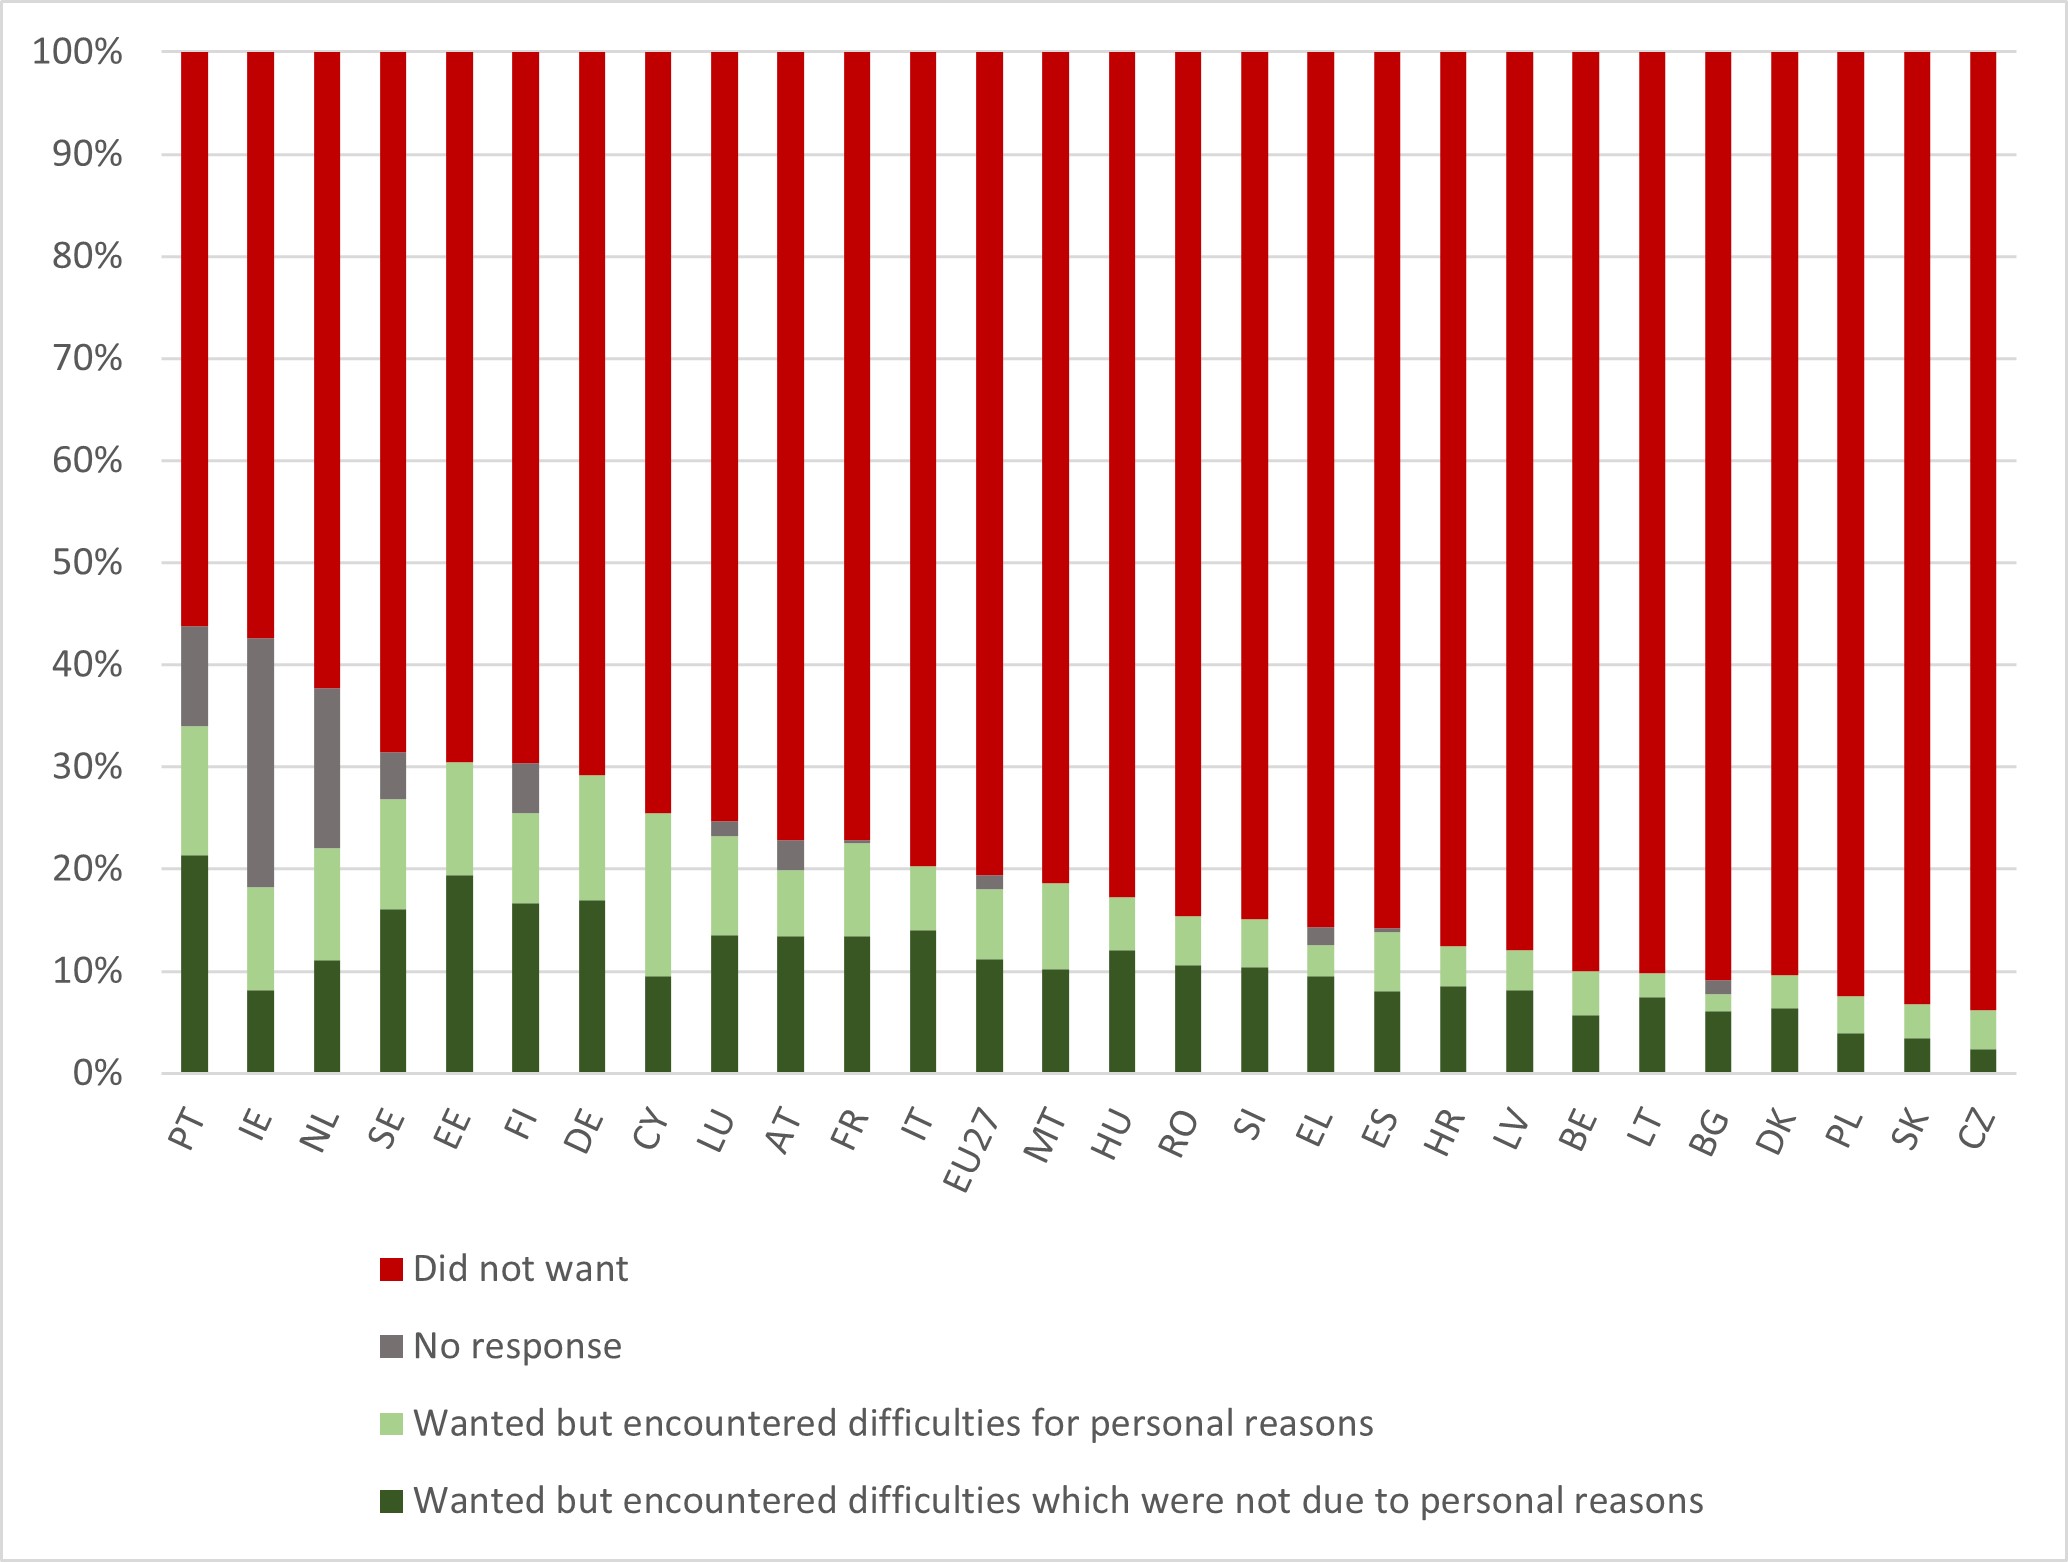
Figure 16. Adult population not participating in education and training by main reason, AES data incl. GOJT (%). EU-27 and countries, 2022.
Source: Eurostat, AES (trng_aes_195, access date: 12/03/2026). Some data points are accompanied by a ‘u’ flag: low reliability. The following categories and countries are concerned: 'Wanted but encountered difficulties which were not due to personal reasons' data for DK and SK, 'Wanted but encountered difficulties for personal reasons' data for BG, DK and SK and 'No response' data for SE, LU, FR, ES and BG. Data on every category for CZ are accompanied by a 'd' flag: definition differs. 'No response' data for EE, DE, CY, IT, MT, HU, RO, SI, HR, LV, BE, LT, DK, PL, SK and CZ are not available.
Figure 16 shows that among adults not participating in education and training in the EU-27 in 2022 the vast majority claimed that the main reason was that they ‘did not want’ to (79.5%). In all countries, this is the category with the highest share of answers (55% or more). On average, apart from the small percentage of no response (1.3%), adults not participating who opted for a different answer are divided between those who indicated difficulties not related to personal reasons (that is, external factors) (11%) and those who pointed to difficulties related to personal reasons (6.8%).
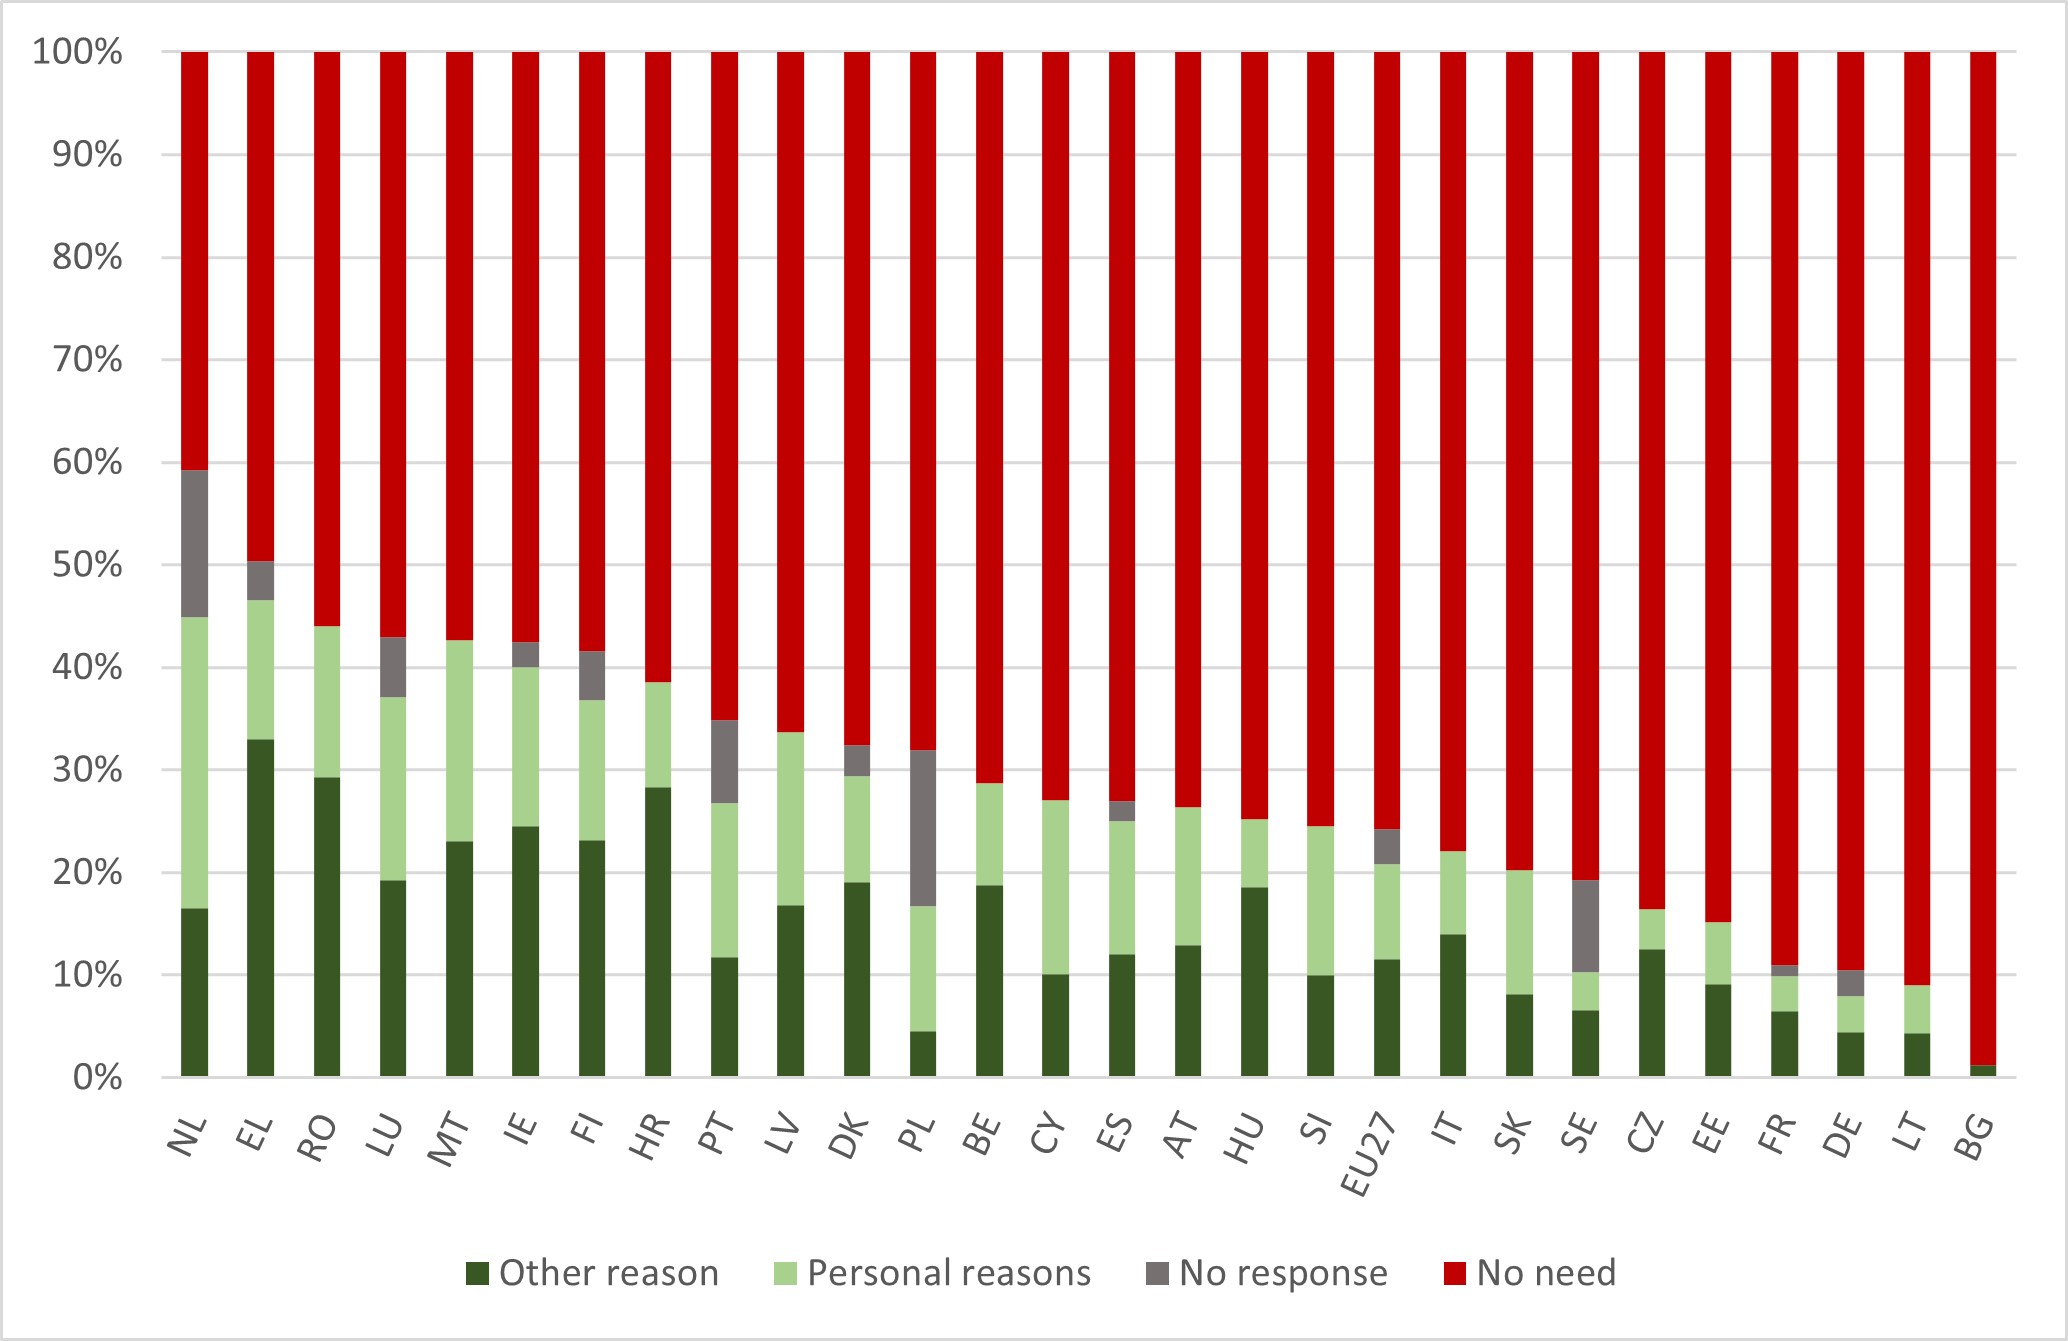
Figure 17. Adult population not wanting to participate in education and training by main reason, AES data incl. GOJT (%). EU-27 and countries, 2022.
Source: Eurostat AES (tng_aes_192, access date: 12/03/2026). 'Other reason' data for BG and 'No response' data for IE and DK are accompanied by a 'u' flag: low reliability. Data on every category for CZ are accompanied by a 'd' flag: definition differs. 'Personal reasons' for BG and 'No response' data for RO, MT, HR, LV, BE, CY, AT, HU, SI, IT, SK, CZ, EE, LT and BG are not available.
Figure 17 shows that the great majority of adults not wanting to participate in education and training in the EU-27 indicate that they feel ‘no need’ to do so (75.9%). This perception relates to the awareness of one’s needs and the ability to assess them, both in relation to individual objectives and in the wider context affecting the perspectives of adults, workers, organisations, societies and economies at large. It also relates to the experience of guidance, which is far from widespread and universal in the EU, with considerable variability across countries and demographic and socio-economic groups (Guidance for adult learning, evidence from the 2022 AES, Cedefop forthcoming).
This is also part of a broader picture of obstacles typically framed as dispositional barriers or attitudes towards learning in major frameworks proposed in the scientific literature (Cross, 1981; Rubenson & Desjardins, 2009), which should be examined: i) alongside institutional and situational barriers, ii) together with financial, time- and information-related barriers, and iii) with reference to all non-participants. The AES survey has some limitations in this sense but allows some indications to be derived.
Figures 18 and 19 focus on adults wanting to participate in education and training but not participating, by main reason for not participating.
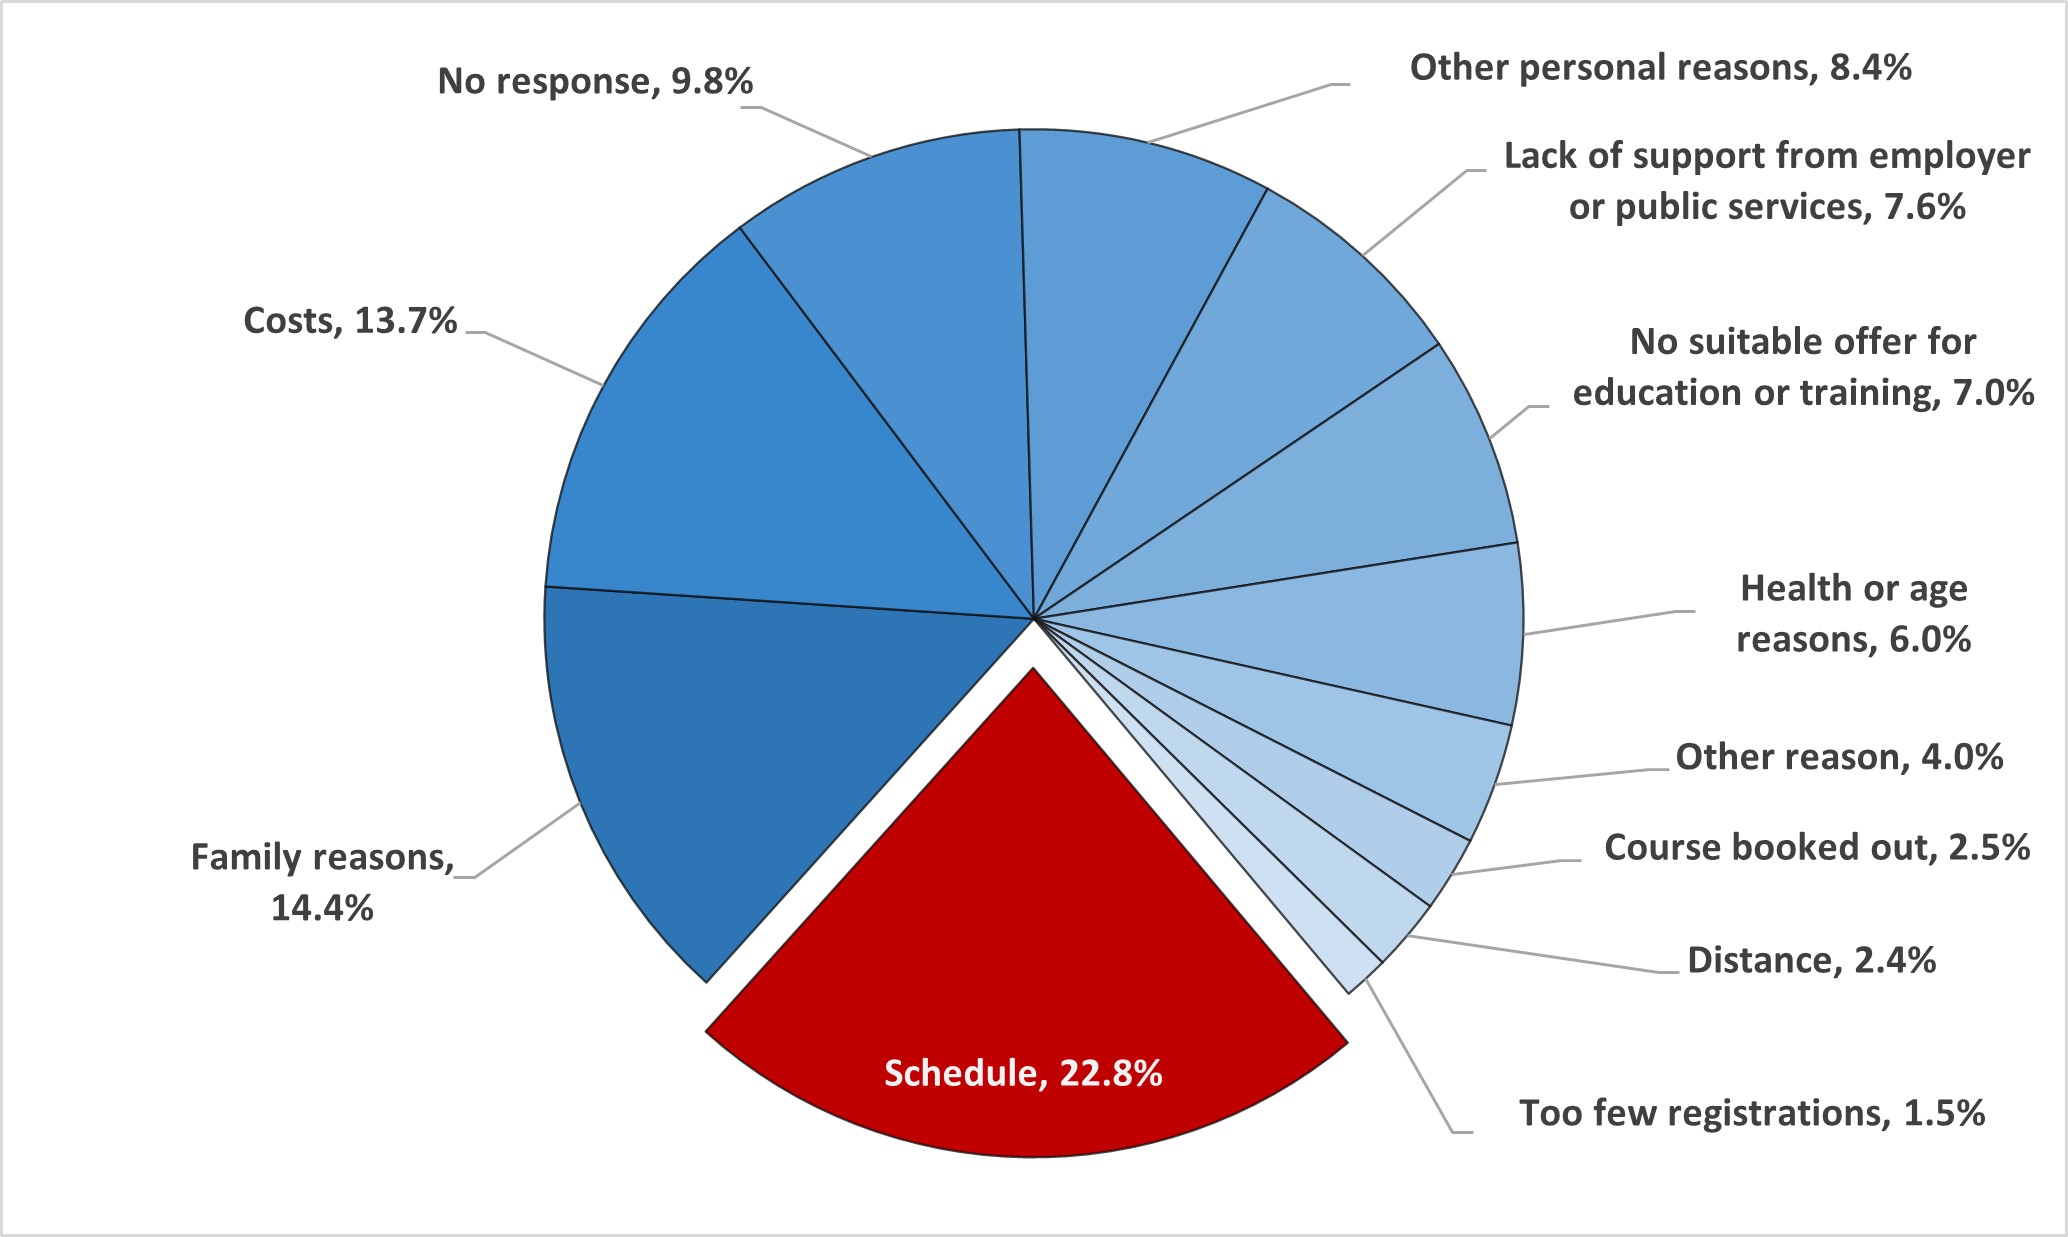
Figure 18: Adult population wanting to participate in education and training but not participating by main reason, AES data incl. GOJT (%). EU-27, 2022.
Source: Eurostat, AES (trng_aes_179, access date: 12/03/2026).
Although there is a wide variety of obstacles preventing adults who want to participate in education and training from doing so, in the EU as a whole in 2022 the most common ones were time- or cost-related. Schedule incompatibilities were the main obstacle for adults not participating but wanting to (22.8%), followed by family reasons (14.4%) and costs (13.7%) (Figure 18). Together, these three account for 50.9% of the total.
Figure 19. Adult population wanting to participate in education and training but not participating by main reason, AES data incl. GOJT (%). EU-27 and countries, 2022.

Source: Eurostat, AES (trng_aes_179, access date: 12/03/2026). Some data points are accompanied by a ‘u’ flag: low reliability. The following categories and countries are concerned: 'Schedule' data for DK and NL, 'Family reasons' data for BG, LT and DK, 'Costs' data for BG, SK, CZ and DK, 'No response' data for MT, IE, CZ and NL, 'Other personal reasons' data for MT, SK, HR, IE, FI and DK, 'Lack of support from employer or public services' data for MT, HU, SI, LT, HR, EE, IE, CZ and NL and 'No suitable offer for education or training' data for MT, HU, SK, LT, HR, IE and DK. Data on every category for CZ are accompanied by a 'd' flag: definition differs. Some data points are not available. The following categories and countries are concerned: ‘No response’ data for LV, BG, IT, SI, AT, SK and EL, ‘Other personal reasons’ data for HU, BG, EL and DK, ‘Lack of support from employer or public services’ data for LV, BG, SK and EL and ‘No suitable offer for education or training’ data for BG and EL. ‘Other reasons (combined)’ category is the ad hoc grouping of the ‘Health or age reasons’, ‘Other reason’, ‘Course booked out’, ‘Distance’ and 'Too few registration’ categories. These usually have high proportions of low reliability flags which can be directly consulted in the Eurostat table. In the chart, several countries show a gap at the end of their columns and do not reach the 100% with the sum of every category. This is due to the unavailability of various data points in some of these categories
The distribution and even the order of prominence of the main obstacles that stop adults who want to participate in adult education and training from doing so can vary considerably from country to country (Figure 19).
Costs were the third most common obstacle faced by that subgroup of the population at EU-27 level in 2022 (13.7%), but they reached much higher levels in some countries, such as Romania, where costs were the most common obstacle (31.2%), or Lithuania (24.6%). By contrast, in some other countries fewer than 5% of adults not participating though wanting to did so for cost-related reasons, such as France (4.3%) and the Czech Republic (4.1%).
Time-related obstacles also vary between countries. Cyprus is a visible outlier for the ‘family reasons’ obstacle, being the only country where more than 30% of adults wanting to participate in adult education and training but not doing so reported this as the main reason (44%). As for the schedule obstacle, there is no such outlier, but eight countries exceed the 30% threshold: Malta (41.3%), Latvia (40.1%), Hungary (38.1%), Bulgaria (37.1%), Italy (33.1%), Belgium (32.3%), Slovenia (31.4%) and Austria (30.1%).
In any case, these two last obstacles are involved in another noteworthy pattern when analysed separately by gender.
Figure 20. Adult population wanting to participate in education and training but not participating by main reason and sex, and percentage gap by sex (Women - Men), AES data incl. GOJT (%). EU-27, 2022.
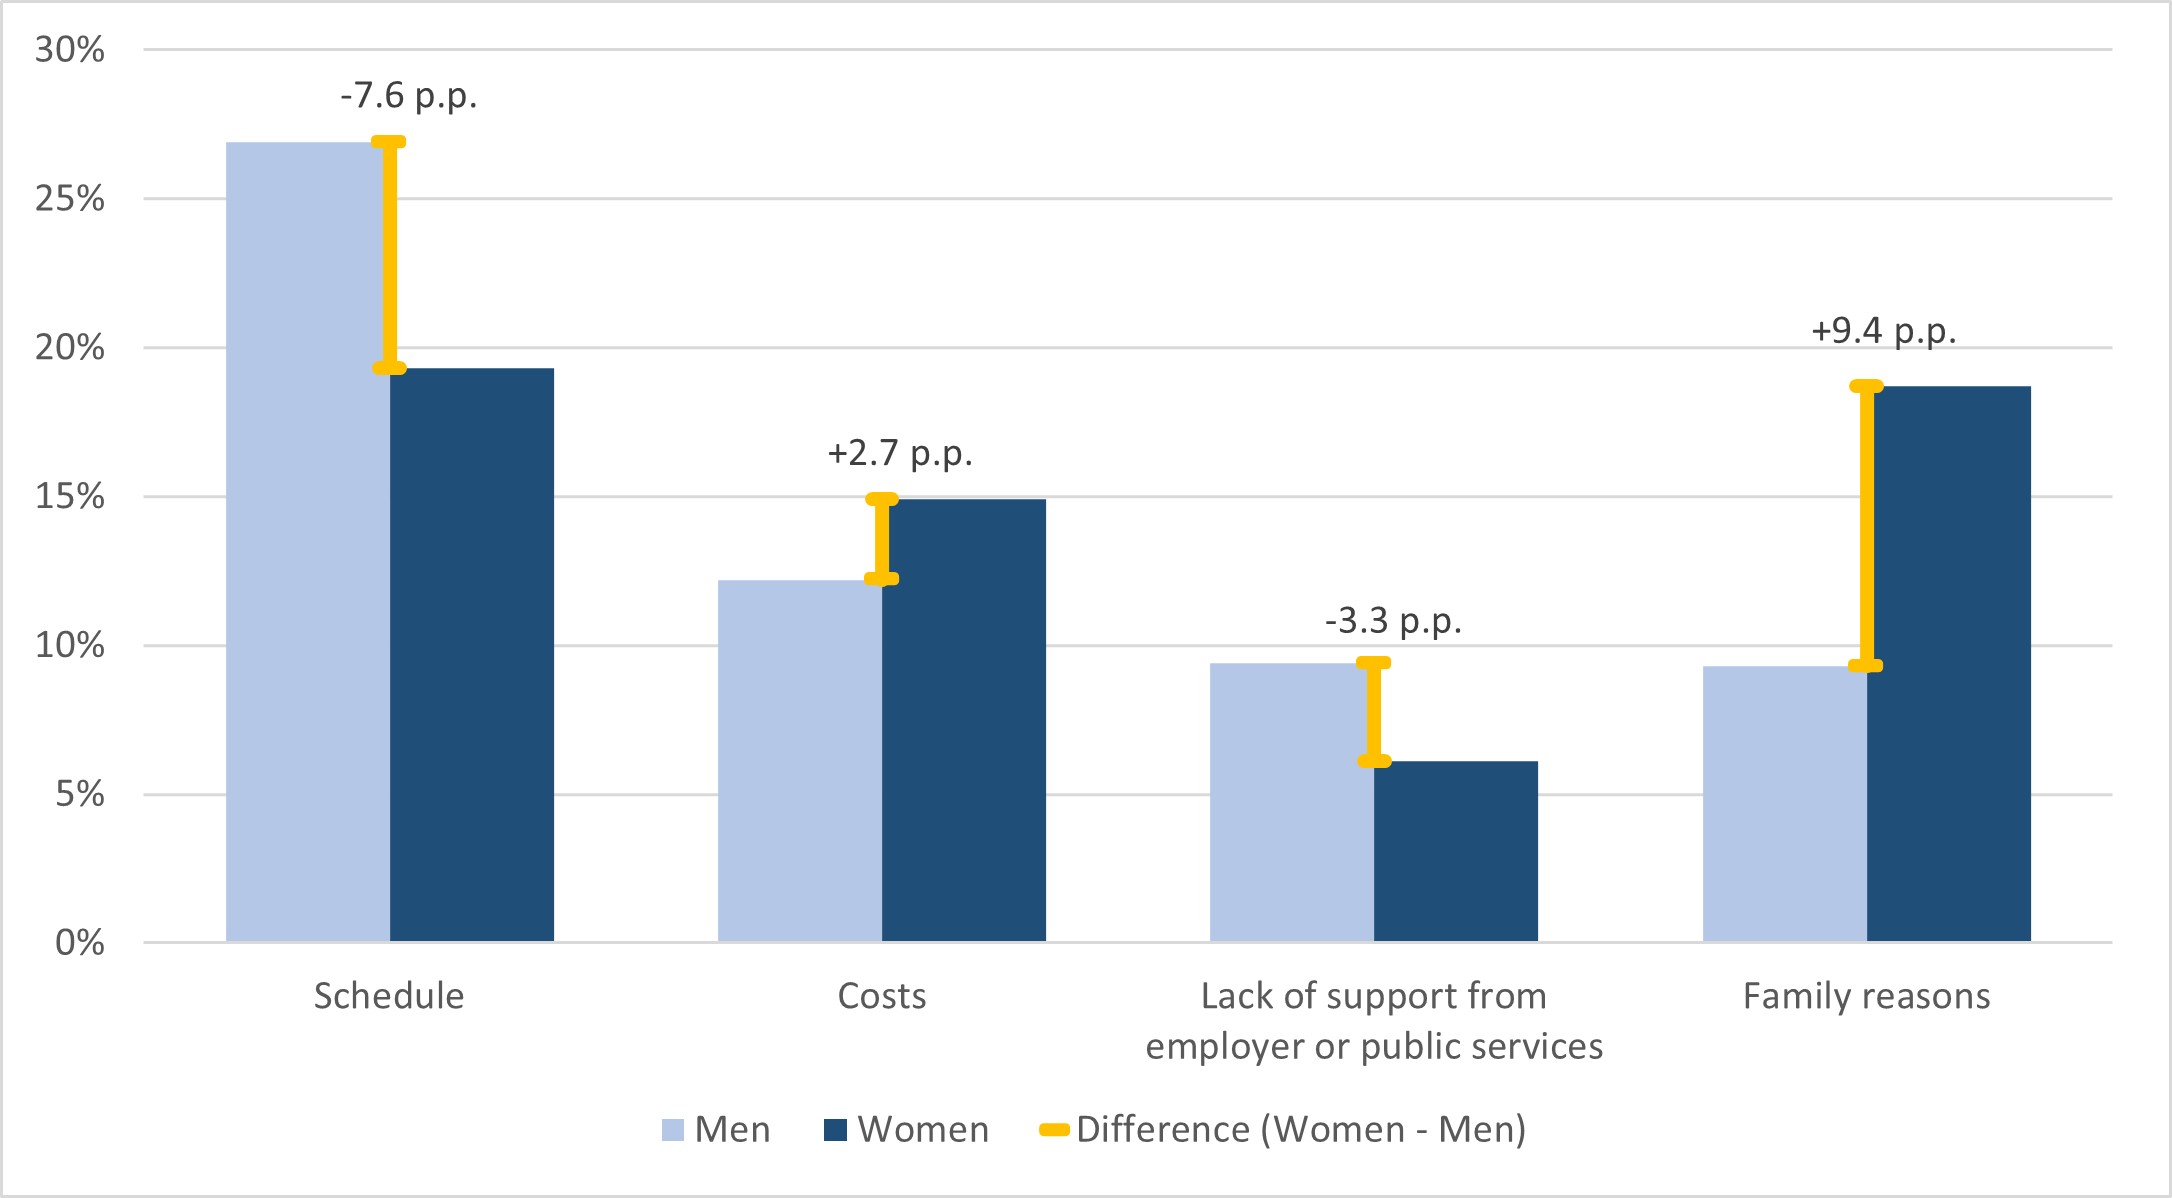
Source: Eurostat, AES (trng_aes_179, access date: 12/03/2026).
Figure 20 shows 2022 EU-27 values for four selected items indicated as main obstacles to participation in education and training by adult men and women who did not participate but wanted to, along with their differences in response by gender. As is evident, reasons for not participating are not equally distributed across the adult population wanting to participate. Some obstacles seem to affect women more than men and vice versa.
The biggest difference is found in the ‘family reasons’ obstacle, stated as the main one by 18.7% of women and 9.3% of men (9.4 percentage points difference). On the other hand, the ‘schedule’ obstacle works the other way around (with a 7.6 percentage points difference in favour of men). This points to an important imbalance in the gender distribution of obstacles to education and training that deserves its own consideration, but also again highlights the overall importance of time-related conflicts and difficulties when wanting to participate in education and training. Other relevant variables are ‘costs’, which also affect women’s participation more, and ‘lack of support from employer or public services’, which men find more impeding.
Figure 21. Adult population wanting to participate in education and training but not participating by main reason and age groups (25¬ 34 years old and 55 64 years old), and percentage gap (oldest - youngest), AES data incl. GOJT (%). EU-27, 2022.
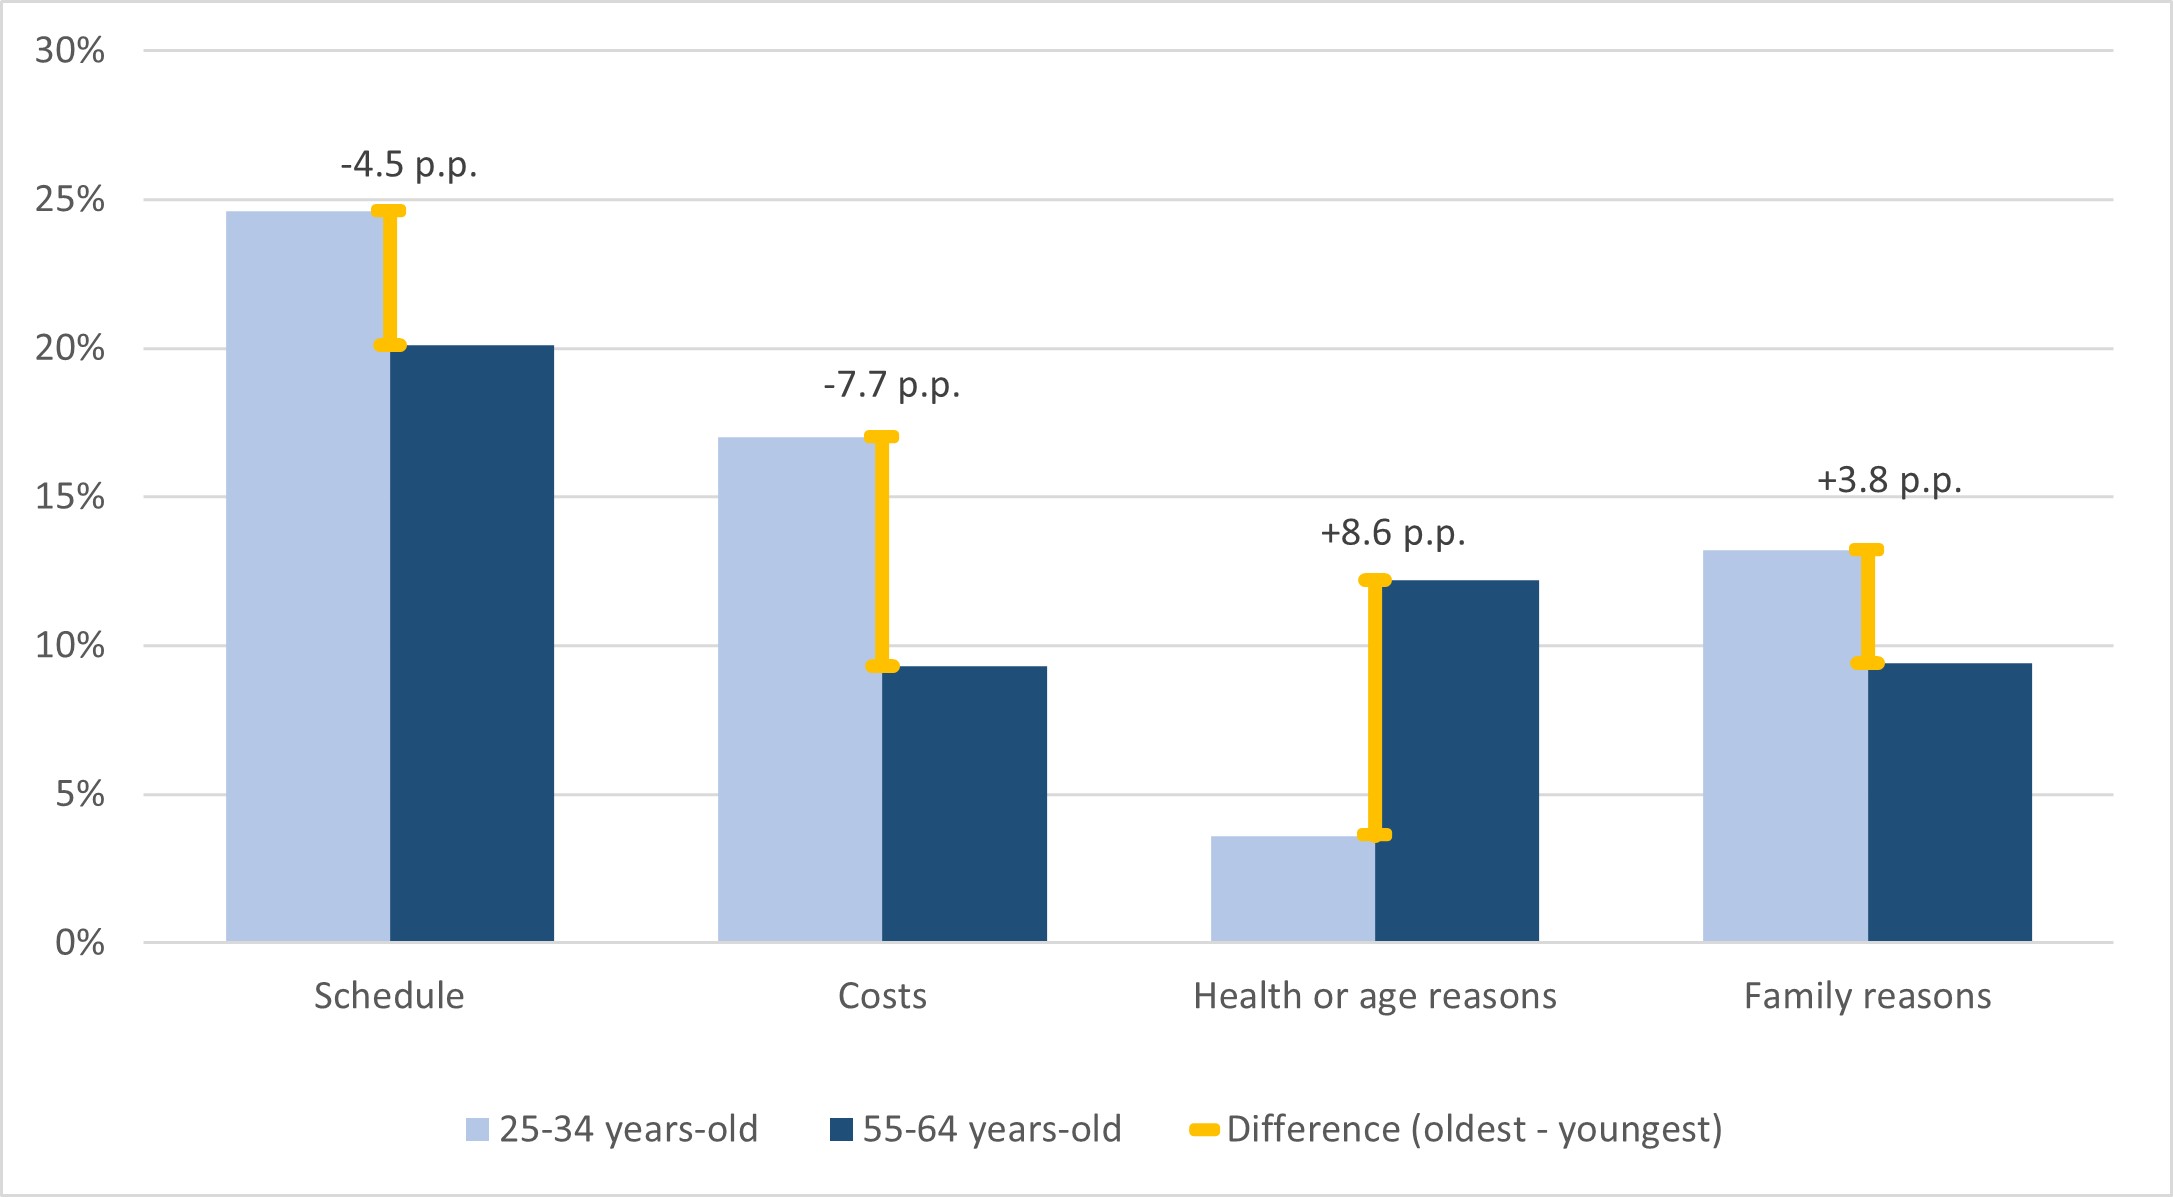
Source: Eurostat, AES (trng_aes_180, access date: 12/03/2026).
The same kind of analysis can be done with the age variable, now focusing on the youngest and oldest groups of adults considered for this article (Figure 21). As could have been expected, ‘health or age reasons’ are the main point of divergence between these two groups: for adults aged 55-64 this is the main reason in 12.2% of cases, while the same happens only in 3.6% of cases when the respondents are 25-34 years old (8.6 percentage points difference). By contrast, younger adults are more likely to consider ‘costs’ as the main reason for not participating, with a difference of 7.7 percentage points compared with the older group. Other, smaller differences are found in the more time-related reasons of ‘schedule’ and ‘family reasons’, the first being more commonly pointed out by the younger group of adults and the latter by the older one.ns’, the first being more commonly pointed out by the younger group of adults and the latter by the older one.
Figure 22. Adult population wanting to participate in education and training but not participating by main reason and highest level of educational attainment (ISCED levels 0 2 and ISCED levels 5 8), and percentage gap (highest – lowest qualified), AES data incl. GOJT (%). EU-27, 2022.
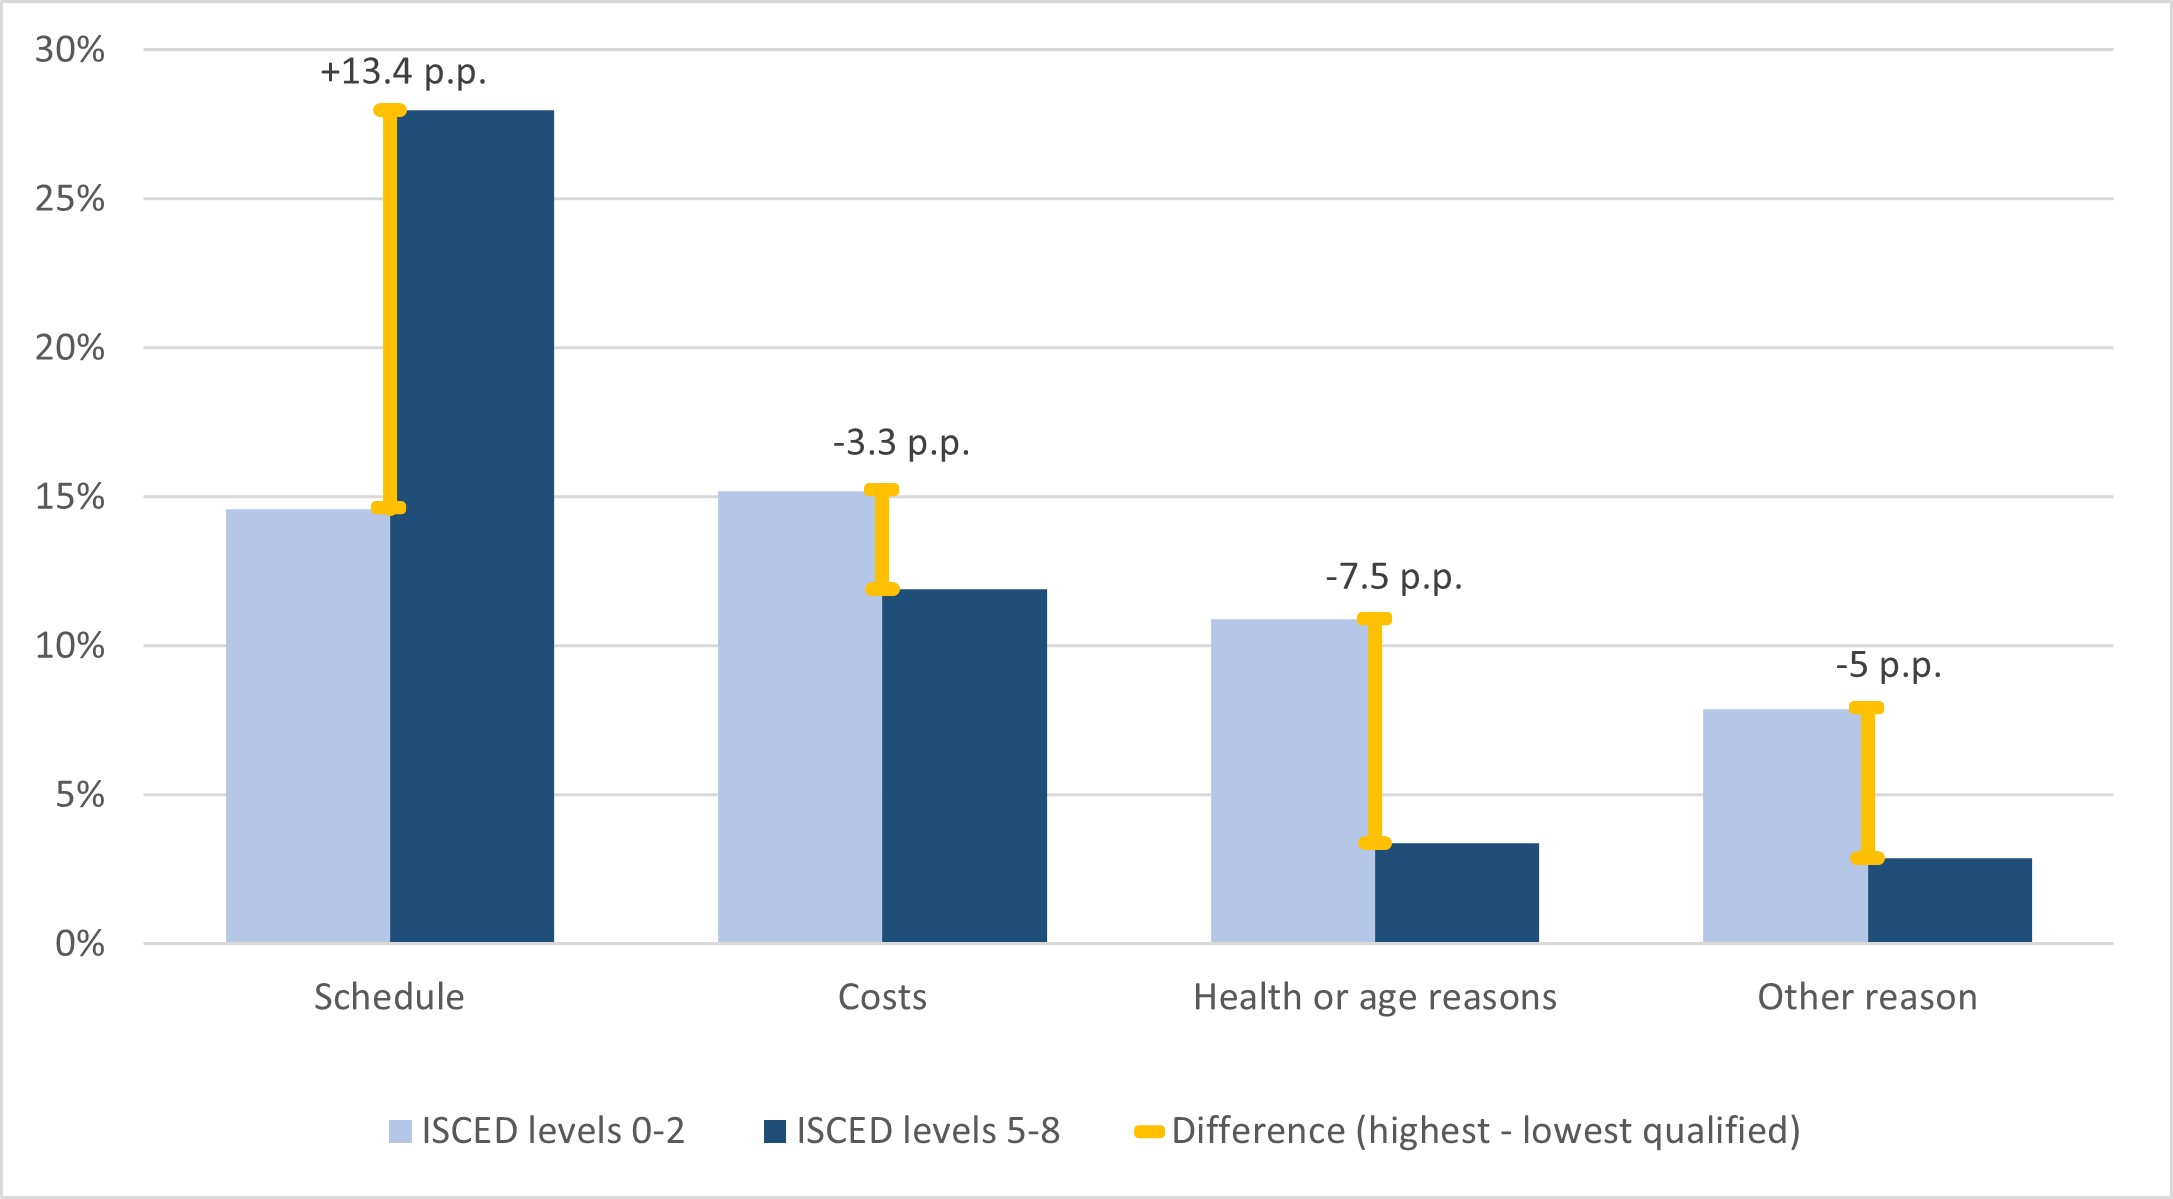
Source: Eurostat, AES (trng_aes_181, access date: 12/03/2026).
Finally, Figure 22 compares the main reasons given by adults not participating in education and training by highest level of educational attainment, focusing on the groups of adults with the lowest and the highest qualifications. The greatest difference found in this last section regarding main reasons for not participating is between these two groups of adults. The higher-qualified group of adults has a much stronger tendency to consider ‘schedule’ as the main reason, which is chosen in 28% of cases, than the lower-qualified group, for whom it is the main reason in 14.6% of cases (a 13.4 percentage points difference). By contrast, lower-qualified adults tend to point out ‘health or age reasons’ more, with a 7.5 percentage points difference compared with higher-qualified adults. It should also be noted that, for the first time in the last three charts, ‘costs’ instead of ‘schedule’ is the most common main reason for a subgroup of adults: low-qualified adults, who consider it the main reason for not participating in 15.2% of cases, 0.6 percentage points more than their own rate for ‘schedule’ and 3.3 percentage points more than the rate for the same reason for the high-qualified group of adults.