As European Union Member States are welcoming millions of people fleeing the war in Ukraine, Cedefop is comparing data on educational achievement of Ukrainian and EU students to help optimise the access of refugees to education in their host countries.
Cedefop’s Ralph Hippe and Maciej Jakubowski and Tomasz Gajderowicz of the University of Warsaw have analysed findings from PISA 2018 to shed more light on similarities and differences between the basic level of skills of school pupils in Ukraine and the EU-27. One of their most positive conclusions is that in this effort EU policy may make best use of the enhanced expectations and ambition of Ukrainian students.
PISA, the OECD's Programme for International Student Assessment, measures 15-year-olds’ ability to use their reading, mathematics and science knowledge and skills to meet real-life challenges.

Average skills of 15-year-olds in Ukraine are lower than in most EU Member States. Taking the average of reading, mathematics and science results, Estonia, Finland and Poland had the highest scores in PISA 2018, while the lowest were in Bulgaria and Romania. If we added Ukraine to the picture, it would be in the bottom part but still higher than Bulgaria and Romania. Results in Ukraine are, depending on the subject, comparable to results in Greece, Malta, Slovakia, Croatia, Luxembourg, and Italy.
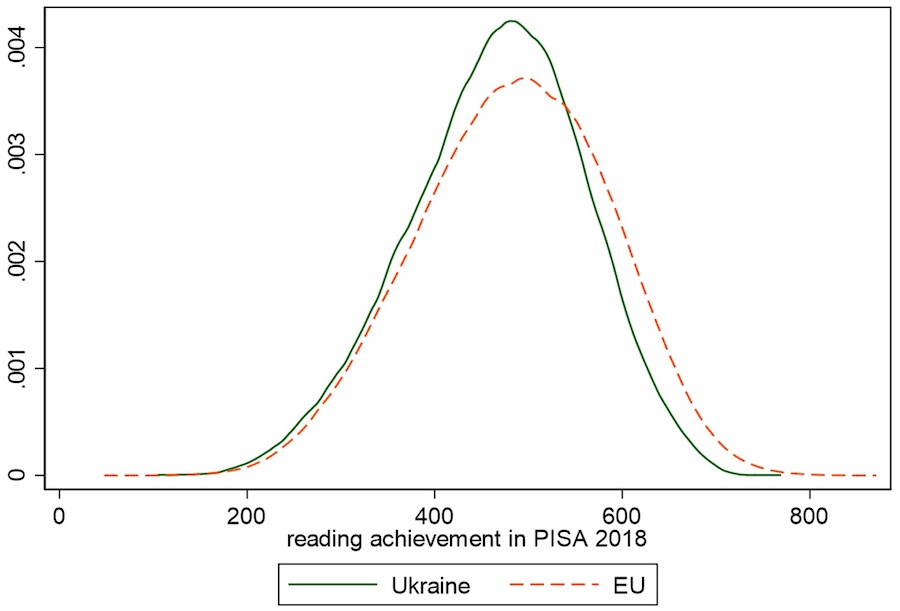
However, not only the average achievement is relevant, but also how it is distributed. Considering reading achievement, we see that the distribution is narrower for Ukraine than for EU Member States with similar numbers of low-performing students and a smaller share of top performers. In other words, the reading achievement is more homogeneous among Ukrainians. This is not a surprise, as the EU is made up of 27 countries which are diverse in terms of culture, language, geography, history, etc. Still, what it also implies is that fewer 15-year-old Ukrainians are able to achieve the highest reading proficiency.
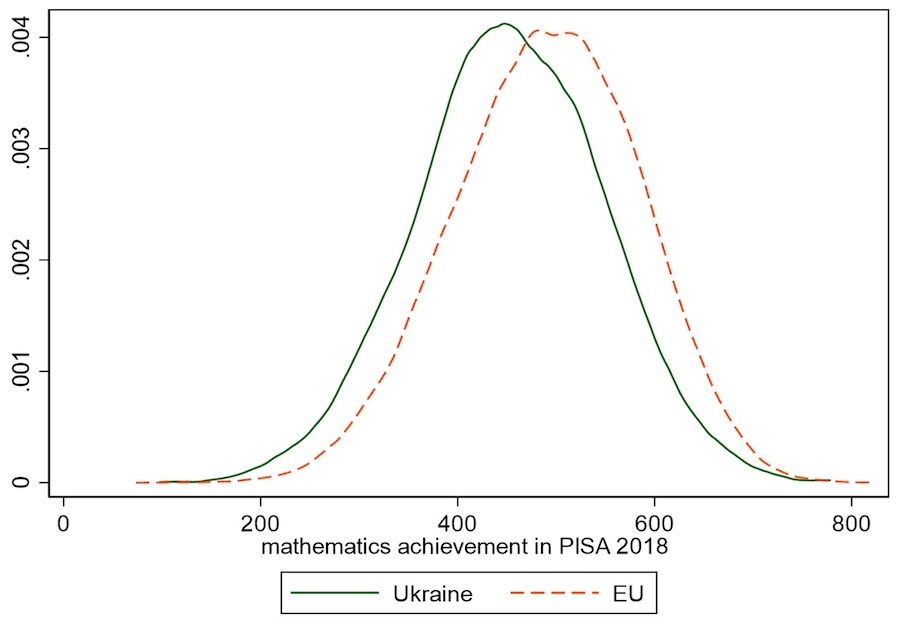
If we consider maths instead of reading, the picture is quite different. While the shape of achievement distribution is rather similar for both Ukraine and the EU, the maths achievement is much lower in Ukraine at all levels. Fewer Ukrainians have the highest maths proficiency and many more do not master essential knowledge and skills.
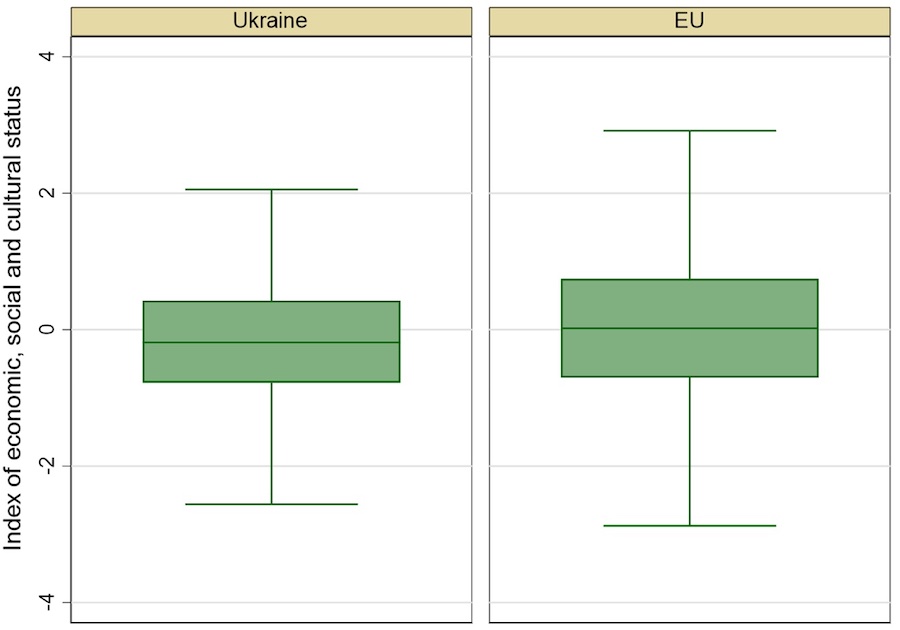
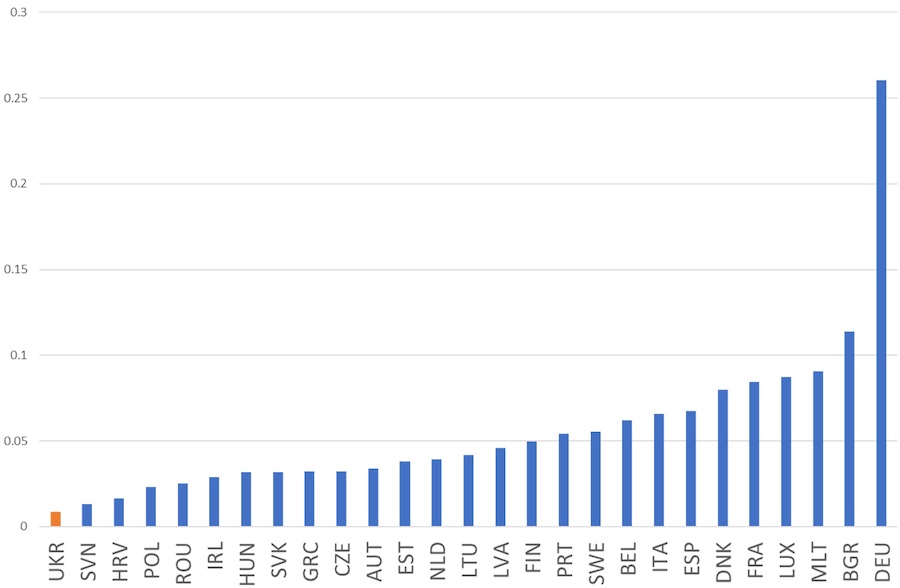
An important factor that determines PISA scores has consistently been the socioeconomic background of students. Overall, students with a lower socioeconomic background achieve lower scores than those with a higher one. A student's parental and financial background is a key reason explaining achievement. With this background information in mind, we find that Ukrainian students have a lower socioeconomic background on average than the EU-27, but still the distribution overlaps with that for the EU.

If we look at country scores in combination with socioeconomic background, we see that the average science and reading achievement is as expected in Ukraine vis-à-vis the EU-27, i.e. Ukrainian results are as expected considering the lower average student socioeconomic background. In contrast, in mathematics the results are much lower than would have been expected.

This finding is further validated by comparing Ukraine to the EU as a whole and by looking at the relationship at the student level. Results are similar based on socioeconomic background for the EU block and Ukraine in reading and science, but the gap is evident when it comes to mathematics.
Ukrainian students achieve lower scores, which is to a relevant degree explainable given their lower socioeconomic background. They are lack in basic skills, such as reading, maths and science. It may be a challenge to integrate these students, as they may have difficulties in following classes in EU Member States.
Strong emphasis should be put on mathematics, in which they have particular difficulties. However, the positive point is that mathematics is itself a universal, logical language, so that appropriate methods are less dependent on the language.
Reading skills, while being lower, show that there is no particular problem with acquiescing skills related to language as such, but evidently studying now in a new, foreign language poses a major challenge to Ukrainian students.
The importance of socioeconomic background shows that programmes supporting the integration of students so that they can study and live in appropriate and safe conditions in EU Member States, is a key ingredient to the successful integration in the EU education systems.
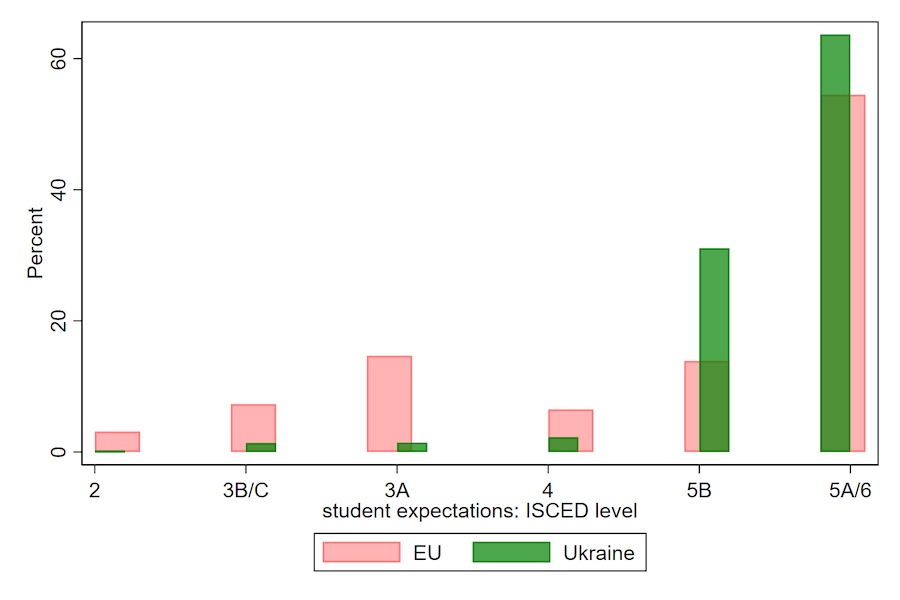
However, the situation is far more positive if we look at student ambition. Their educational expectations are particularly relevant as they give an idea what Ukrainian refugee students may want to achieve in the EU education systems and how long they want to continue their studies. Indeed, we find that Ukrainian students are very ambitious: asked about the International Standard Classification of Education (ISCED) level that they would like to achieve, they indicate a much stronger wish to attain tertiary education degrees than EU students on average.
Fewer want to drop out from school early , which can be explained by the fact that it is obligatory in the Ukrainian education system to finish upper-secondary education. While there is a danger that displaced refugee students might have a higher dropout rate given the many adverse factors, such as that they may not speak the language of their host country, socioemotional and economic difficulties as refugees, etc., the mindset and ambitions of Ukrainian students are favourable towards continuing their studies against all odds.