Is IVET an attractive learning choice?
European education and training policy promotes initial vocational education and training (IVET) as an attractive learning choice (Osnabrück Declaration (2020), Council Recommendation on Vocational Education and Training (2020)). Participation in initial VET can be considered a proxy measure of its attractiveness, although it does not always and necessarily reflect individual preferences for general or vocational education.
Figure 1. a shows the number of students enrolled in vocational programmes at various ISCED levels, in millions and as a percentage of students enrolled at the same level. Data are presented for 2015 and 2022.
Initial VET mainly starts and mainly takes place at upper secondary level of education (ISCED level 3). At this level, in 2022, there were 8.9 million IVET students in the EU, almost half of the total number of upper secondary students (49.0%). Enrolments in upper secondary VET have remained relative stable over the period 2015-2022 in the EU: at ISCED level 3, the number of VET students went up by 0.2 million and their share (as a percentage of all students enrolled in upper secondary education) went up by 0.1 percentage points.
Figure 1.a - Students in VET by ISCED levels 2 to 5 (in million and as % of students in the same ISCED level), students enrolled in ISCED 6 to 8. EU. 2015 and 2022.
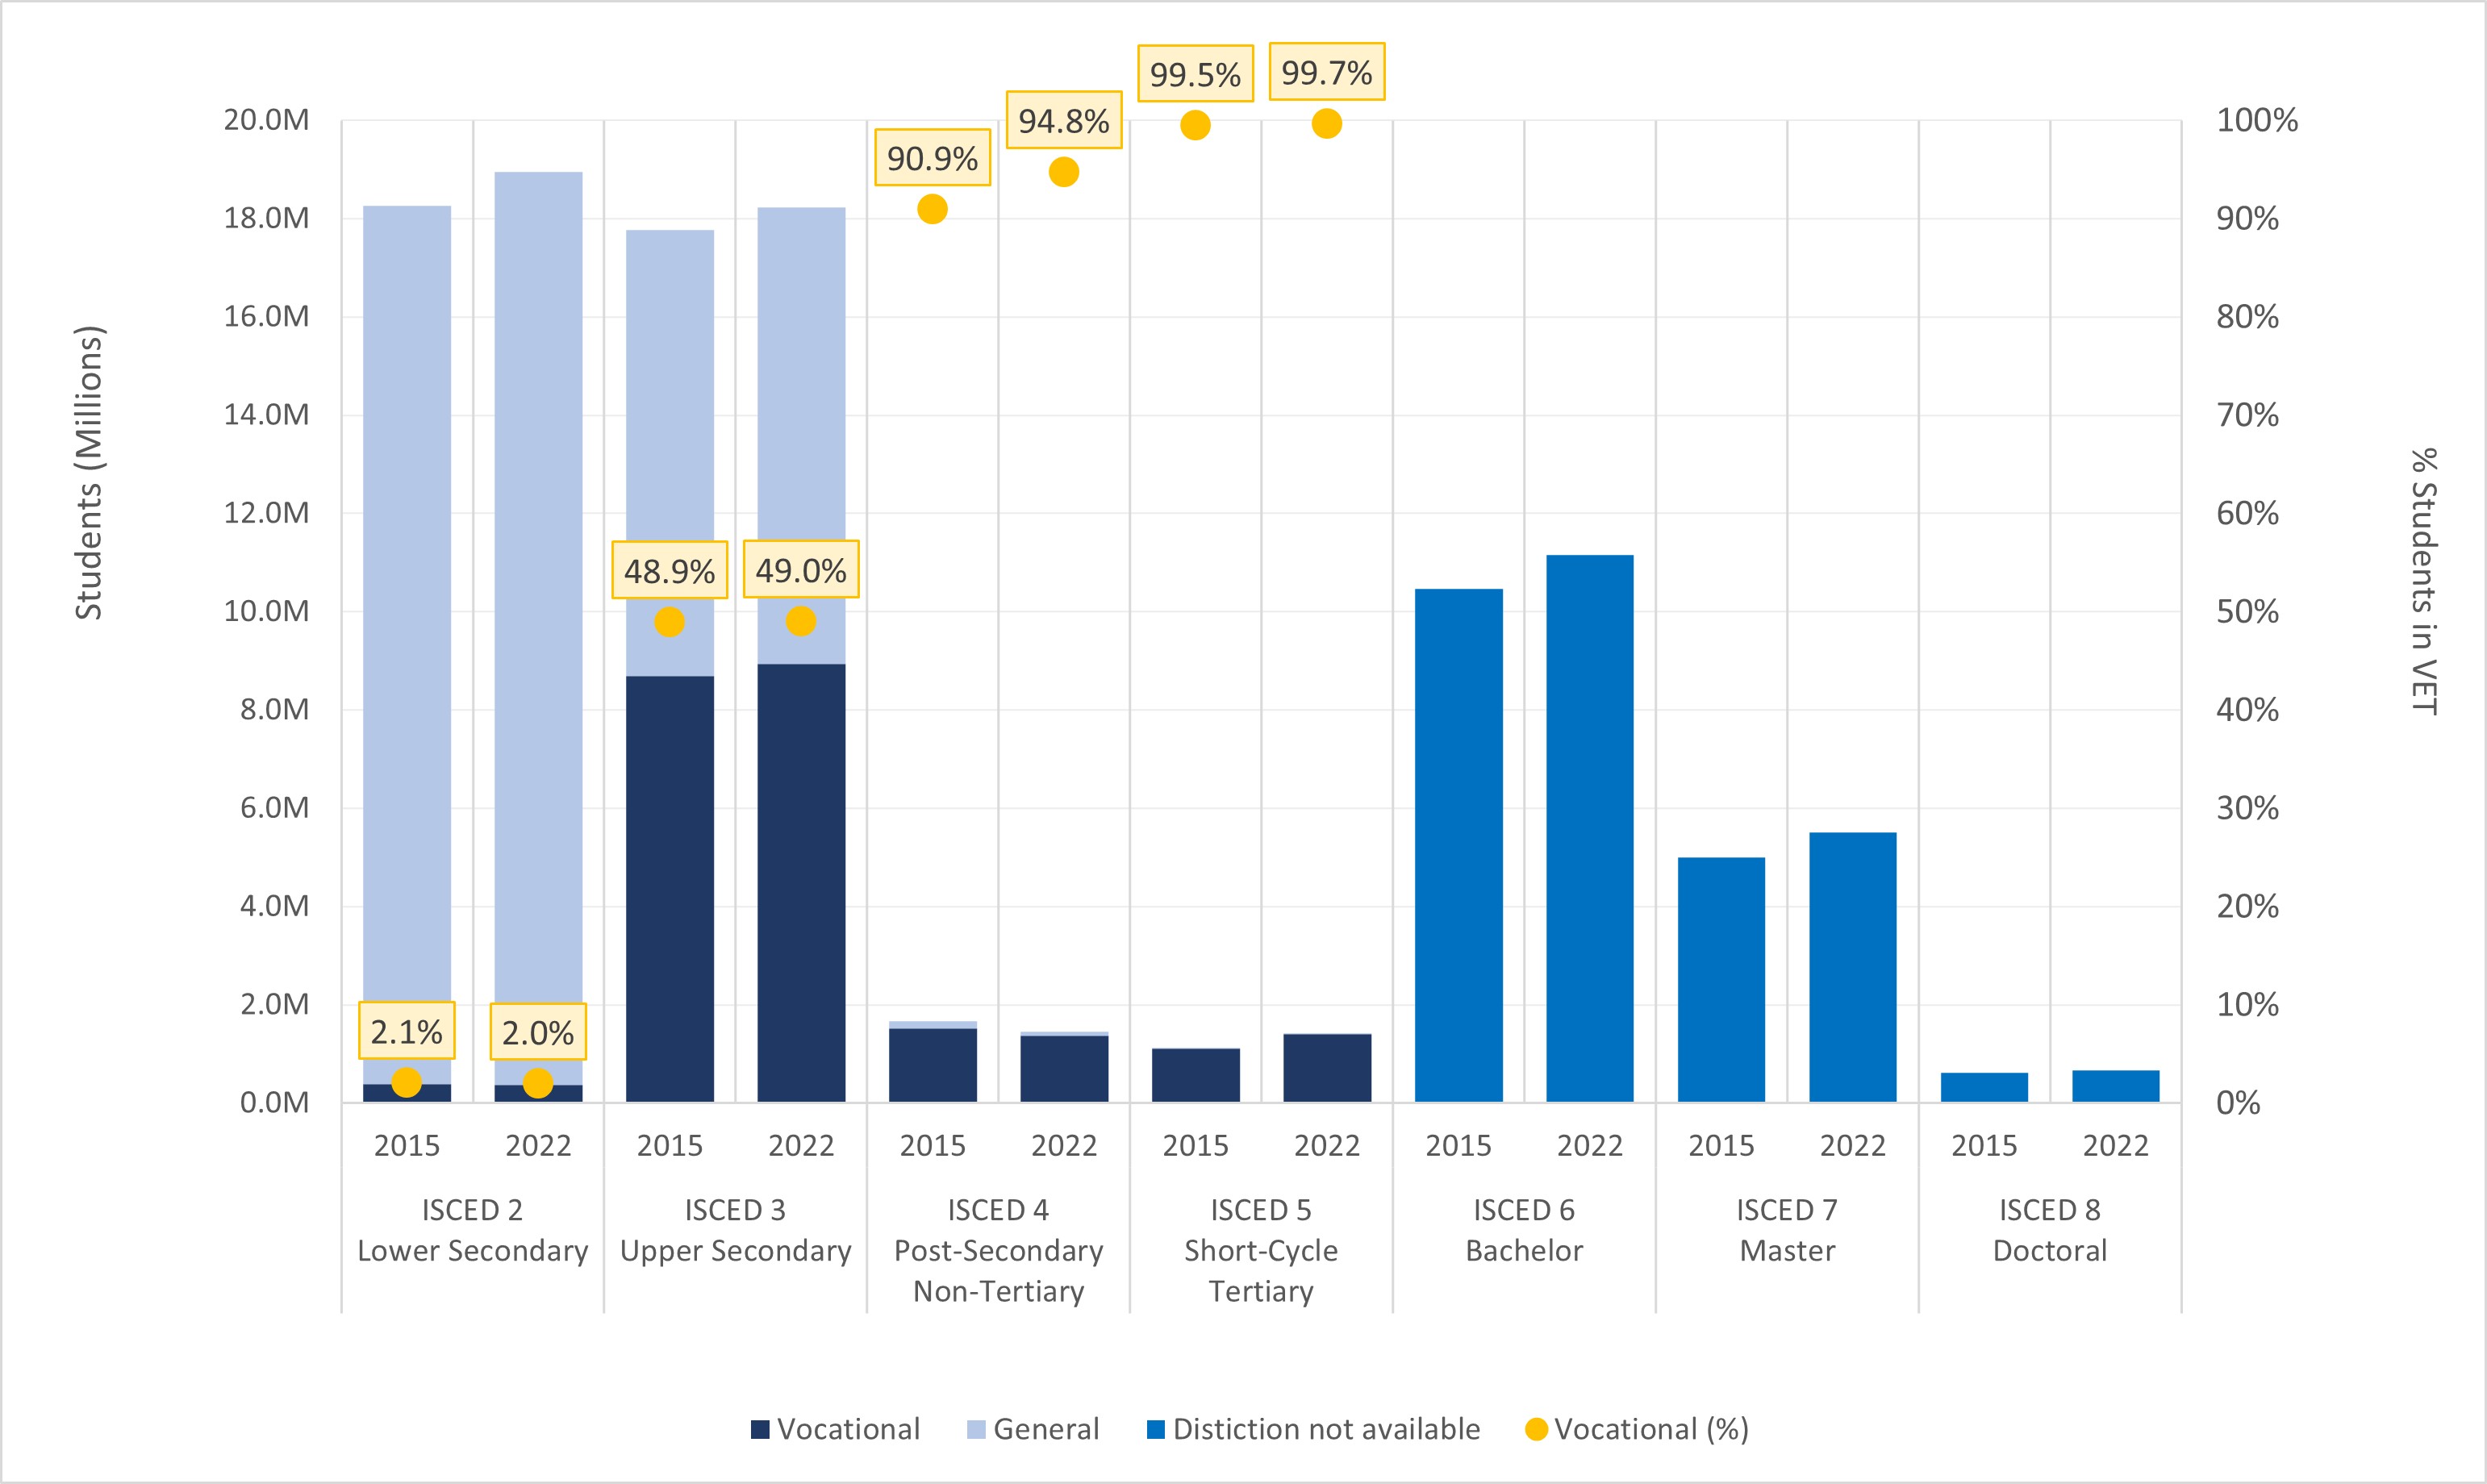
Source: Cedefop calculation based on Eurostat data, UOE data collection on formal education. NB : Vocational Students absolute numbers: ISCED 2: 2015 - 0.4M, 2022 - 0.4M; ISCED 3: 2015 - 8.7M, 2022 – 8.9M; ISCED 4: 2015 – 1.5M, 2022 – 1.4M; ISCED 5: 2015 – 1.1M, 2022 – 1.4M.
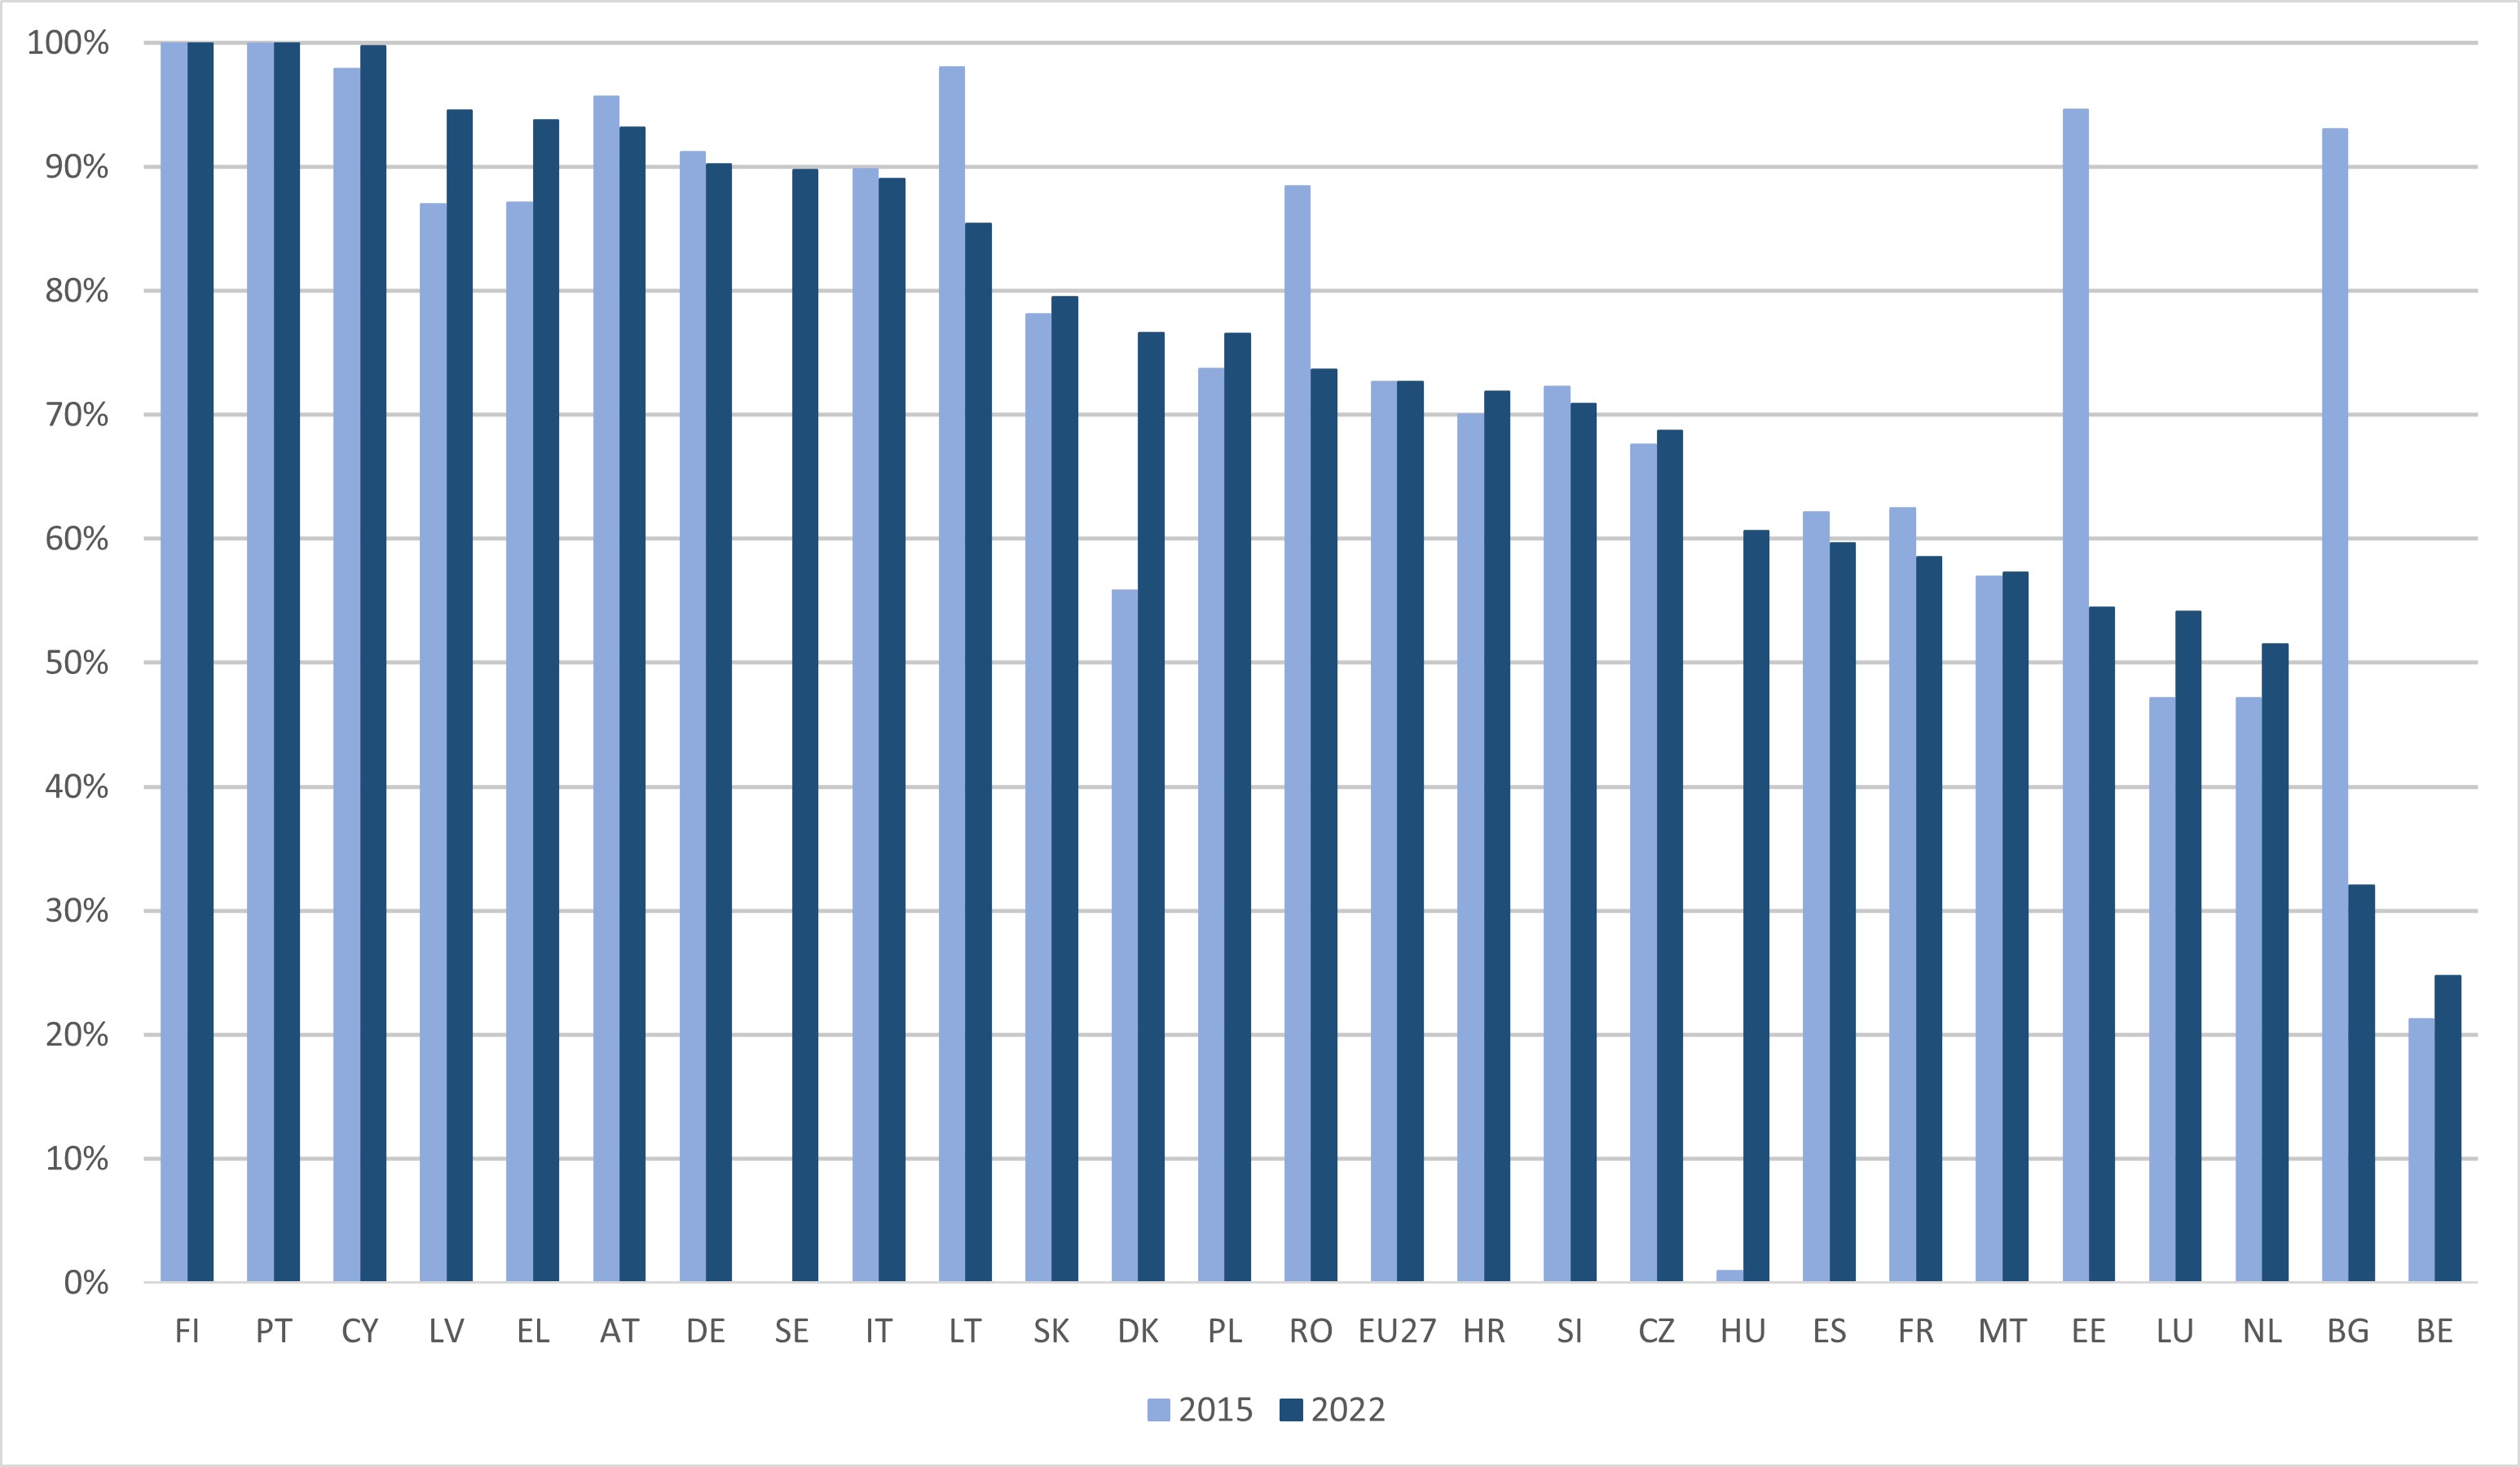
Considerable cross-country variability persists (Figure 1.b). The number of students in upper secondary VET as a percentage of all upper secondary students ranges from 71.5 % in Croatia to 17.9% in Cyprus. From 2015 to 2022, most countries have shown minor increases since 2015. Changes have been between +/- 5 percentage points, apart from 3 countries. Based on available data, In Hungary, an increase by 29.8 percentage points is observed (the largest change). In Portugal and Belgium there were drops by 6.0 and 5.5 percentual points, respectively. Belgium still has more than half of students enrolled in vocational programs (54.1%); it is not the same case for Portugal where only 38.9% (lower than EU27 average) attend VET at upper secondary level.
Figure 1.b - IVET students at ISCED 3 (as % of all upper secondary students). 2015 and 2022.

Source: Cedefop calculation based on Eurostat data, UOE data collection on formal education.
At ISCED level 4 (post-secondary non-tertiary level) and level 5 (short-cycle tertiary education), enrolments in VET accounts for almost all of the enrolments at the corresponding ISCED levels (more than 90%), but, in absolute terms, they are considerably fewer than the 8.3 million reported at ISCED level 3 (data are for the EU as whole). In 2022, there were 1.4 million VET students at ISCED level 4 (94.8% of all post-secondary non tertiary students) and an additional 1.4 million VET students in short-cycle tertiary education (99.7% of all students at ISCED level 5). As compared to 2015, no substantial change can be observed: IVET at ISCED level 4 showed a drop by 0.1 million enrolments as compared to 2015 (share up by 3.8 percentage points), while IVET at ISCED level 5 showed an increase by 0.3 million students (share up by 0.2 percentage points). VET programmes at ISCED levels 4 and 5 are present in most countries but enrolments still tend to be geographically concentrated. Two thirds of all post-secondary non-tertiary VET students can be found in Germany (49.0%, i.e. 0.7 million) and Poland (17.0%, i.e. 0.2 million); 77.0% of all short-cycle tertiary vocational students in the EU can be found in Spain and France over 0.5 million in each country.
The overall pattern by which, at ISCED level 4 and 5, enrolments are by far large concentrated in vocational programmes holds in almost all countries, however, based on 2022 data for ISCED level 4, in 3 countries, less than half of students were enrolled in vocational programmes: Czechia (22.7%), France (44.1%) and Malta (46.4%). At ISCED level 5, it is observable a drop since 2015, for Malta (41.4%, down from 59.9% in 2015), and for Sweden (92.3%, up from 80.5% in 2015).
In the EU, in 2022, the 1.4 million students in short cycle tertiary VET (ISCED 5) are a small proportion of all students in tertiary education, accounting for about 7.5% of the 18.5 million students at ISCED level 5 or above. This includes 11.2 million students at Bachelor level (ISCED level 6), 5.5 million students at Master level (ISCED level 7) and 0.7 million students at Doctoral level (ISCED level 8). At higher levels of tertiary education (above ISCED 5), international statistics do not distinguish between vocational and general programmes and qualifications. An internationally agreed definition supporting the distinction between academic and professional education that would enable the collection of such data is being discussed. In the EU as whole, enrolments in tertiary education grew as compared to 2015, but there is no sign that this happened at major expenses of enrolments in upper secondary VET, which shows no remarkable decrease in absolute or relative enrolments. The policy attention to IVET in the EU may have well played a role in this sense. It is important to recall that based on Cedefop Opinion Survey on VET (2016), IVET has a positive image as perceived by the general population in the EU, but this perception is not as positive as for education of general orientation: about two thirds of respondents (67.4%), agreed that IVET has a positive image in their country (of which 14.4% very positive and 53% fairly positive); however 73.5% of respondents agreed (31.9%) or tended to agree (41.6%) that general education has a more positive image.
Does IVET provide opportunities for further learning?
Flexibility of learning pathways across levels and types of education and training, permeability of systems, access to further education and training are important aspects for (potential) IVET learners (Osnabrück Declaration (2020),Council Recommendation on Vocational Education and Training (2020)).
In 2022, in the EU, 72.6% of upper secondary IVET students were enrolled in programmes granting direct access to tertiary education. In almost all countries, the 2022 values are higher than 50%. Only in Belgium (24.7%) and Bulgaria (32%), the indicator is lower than that. On the other hand, in Finland, Portugal and Cyprus is close or at 100% (Figure 2.a).
As compared to 2015, EU average estimates did not change. In most countries, the indicator was relatively stable in the period 2015-2022. Largest positive changes are estimated for Denmark (by 20.8 percentage points) and Hungary (by almost 60 percentage points). Largest negative changes are found in Estonia (still above the EU average value) and Bulgaria (now below that)
Figure 2.a - IVET students in programs with direct access to tertiary education (as % of all upper secondary IVET students). ISCED 3. 2015 and 2022.
Source: Cedefop calculation based on Eurostat data, UOE data collection on formal education. NB: data not available for Ireland (both years) and Sweden (2015).
Based on LFS data, it is also possible to estimate the extent to which IVET graduates continue in further education and training and compare results over time and with those related to graduates from the general stream of education. (Figure 2.b).
In 2023, in the EU, an average 38.2% of graduates aged 18 to 24 and holding a medium level vocational qualification as their highest, said that they were in further education and training. There is considerable variation across countries. 2023 estimates are highest for Luxembourg, Romania, Slovenia, Spain, the Netherlands, Bulgaria, and Belgium (all above 50%). Lowest values are estimated for Greece, Cyprus, Germany, and Hungary (all below 30%).
As compared to 2021, the EU average value for the indicator is relatively stable. The same holds in most countries. Largest increases were found in Latvia and Czechia.
Participation in further education and training is typically and considerably lower for young graduates with a medium level vocational qualification than for their counterparts from the general stream of education, which is mainly designed and undertaken to this end (2023 EU average at 81.8%). However, that about 40% of VET graduates in the EU go on to further education and training shows that VET provides opportunities for further learning, and it is not a dead end in this sense.
Figure 2.b - Young IVET graduates in further learning education and training (% of all VET graduates). 2021 and 2023.

Source: Eurostat data, EU LFS. NB: 2021 data for Bulgaria, Croatia, Slovakia, and Slovenia is not published due to a break in time series. Data for Lithuania in both years is not published due to low reliability. Data for Luxembourg general education is not available.
Is IVET international?
The EU promotes internationalisation of education and in particular international mobility for learning purposes, including in IVET. For IVET quantitative targets for the EU as a whole have been established. Based on the Council Recommendation on Vocational Education and Training (2020) 8% of IVET learners should benefit of from a learning mobility abroad by 2025. Based on Council Recommendation 'Europe on the Move' (2024) 12% of them should do so by 2030.
The indicator presented in Figure 3. a is calculated in line with agreed specifications as the percentage rate of mobile IVET learners. This is the number of mobile IVET learners in a calendar year having experienced a mobility abroad of at least 10 days, expressed in relative percentage terms as a proportion of a cohort of IVET graduates in the same year. IVET at ISCED levels 3 and 4 is considered for learners and graduates.
Data are provisional estimates still affected by the impact of the COVID-19 pandemic. Based on those, it is estimated that in 2022, 5.1% of IVET learners benefited from a learning mobility abroad, about 3 percentage points short of the corresponding 2025 target. Comparisons over time are to be interpreted with some caution, but they suggest an upward favourable trend. Due to the transition between the old and new programme, certain variables enabling country level data are absent, therefore country level data are not published for the reference year 2022. Based on 2021 country level estimations, Latvia, Lithuania, and Cyprus were above 8%.
Figure 3.a - IVET students who benefitted from learning mobility abroad. ISCED 3-4. EU. 2020-2022.

Source: Cedefop calculation based on European Commission methodology and specifications, Erasmus+ data supplied at Cedefop request as well as Eurostat data, UOE data collection on formal education. NB: Data are provisional estimates are affected by the impact of the COVID-19 pandemic. Due to the transition between the old and new programme, certain variables enabling country level data are absent, therefore country level data are not published for the reference year 2022.
Learning of foreign languages supports internationalisation and cross-border mobility in IVET. Figure 3.b shows the average number of foreign languages learned by students in upper secondary vocational education. Data are compared with those for students in upper secondary general education.
In the EU, in 2022, students in upper secondary vocational education learned an average of 1.2 foreign languages (Figure 3.b). Data were highest in Luxembourg and Romania (at or above 2) and lowest in Denmark, Spain, and Germany (below 0.5). As compared to 2015, the EU average value resulted relatively stable (up by 0.1 points on the indicator scale). Largest changes by 0.3 points on the indicator scale were observed in Greece and Belgium (increases) as well as in Estonia and Lithuania (drops).
Students in upper secondary vocational education tends to study fewer foreign languages than their counterparts from general education. The 2022 EU average of 1.2 for IVET students compares to 1.6 for students in general education (with a gap by 0.4 points on the indicator scale). Unfavourable gaps are found in almost all countries for which data are available. Only in Portugal, the value for general education is slightly higher than in vocational education and only in Romania and Cyprus is on par. In other countries a gap is observed. This is smallest in Italy and Poland (by 0.1 points on the indicator scale) and largest in Estonia, Germany, and Denmark (at or above 1 point).
Is IVET work-based and how?
VET equips labour force with knowledge, skills and competences that are relevant for the ever-changing labour market and has a distinctive focus and identity, playing a key role at the interface of education and training, employment, and economic policies. Apprenticeships and work-based learning embedded in a real-life work environment improve employability (Osnabrück Declaration (2020)). In the 2010-20 European VET policy cycle, the Bruges communiqué and the Riga conclusions called for work-based learning to become a key feature of initial VET systems.
The Council Recommendation on Vocational Education and Training (2020) and the Council Resolution on the European Education Area (2021) continue to emphasise the importance of work-based learning in VET. They set a quantitative target for the EU overall that, by 2025, 60% of recent graduates from VET aged 20 to 34, who obtained a VET qualification at ISCED level 3-4 as their highest in the last three years, should have experienced a (cumulative) period of at least one month of work-based learning as part of their VET studies, whether paid or not, mandatory or not in their curriculum.
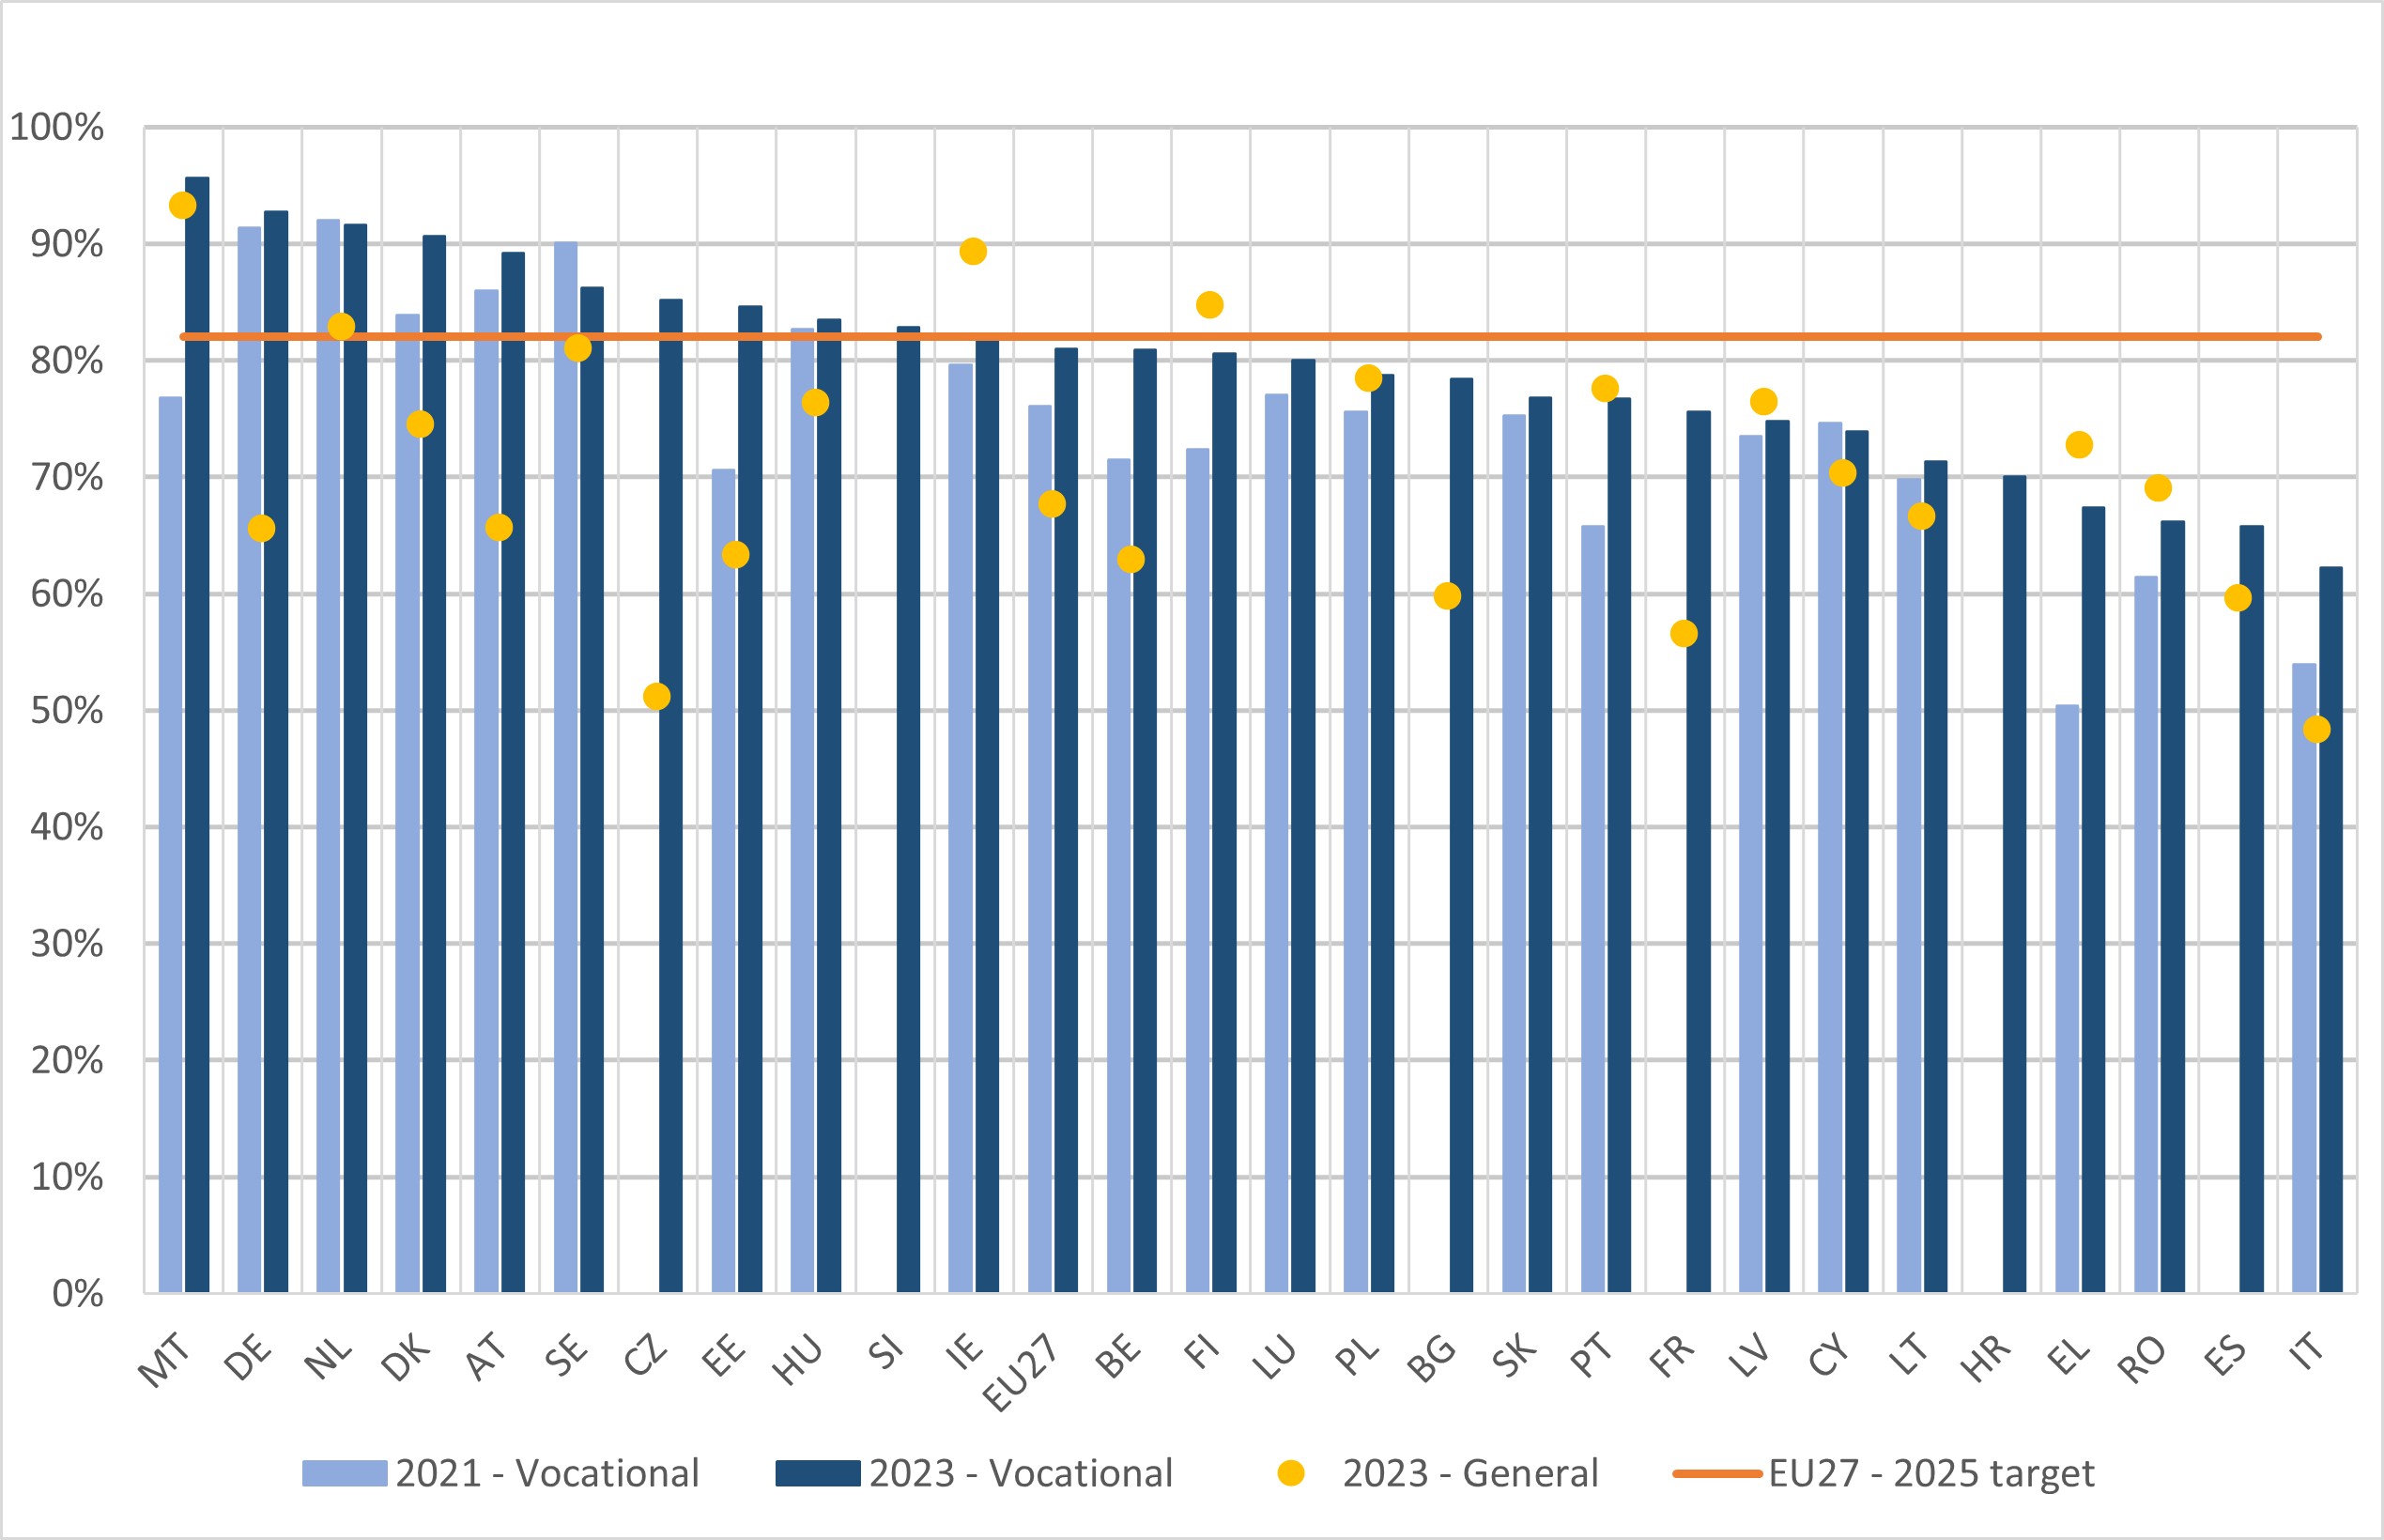
Figure 4.a - Recent IVET graduates (20-34 years old) with a work-based learning experience as part of their vocational education and training (%). 2021 and 2023.
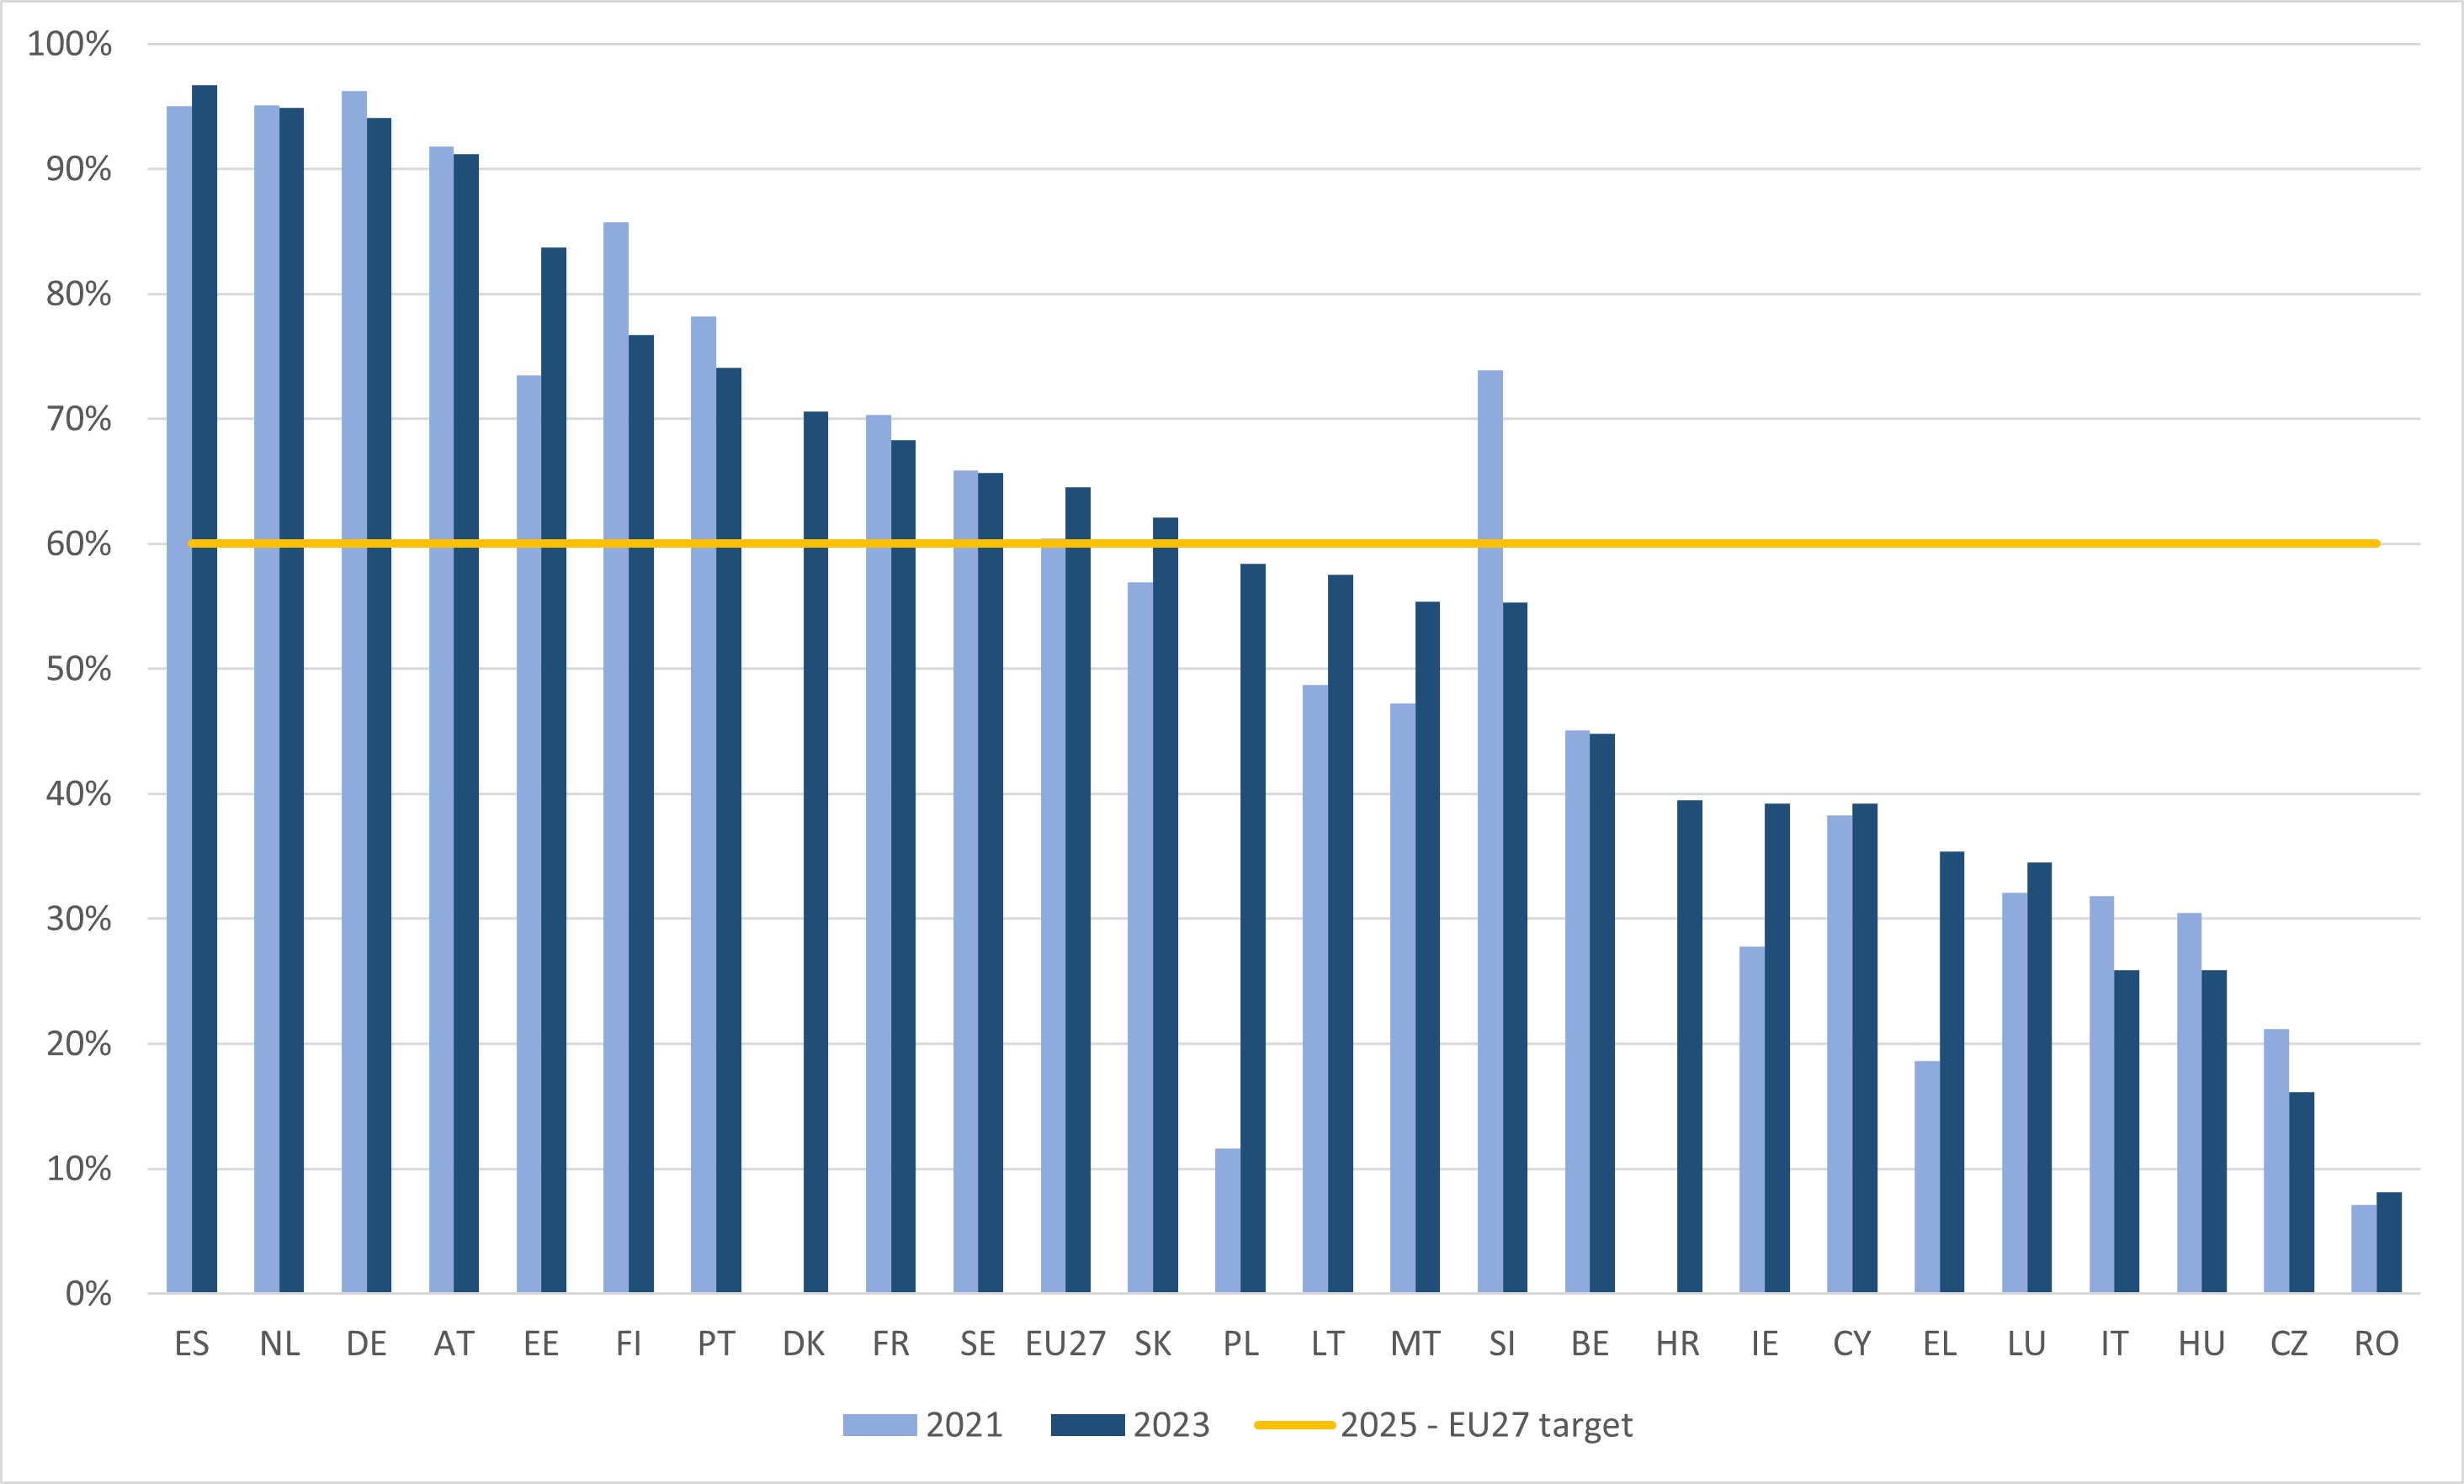
Source: Eurostat, EU LFS. The indicator covers graduates who obtained a VET qualification as their highest at ISCED 3-4 in the last 3 years. NB: Data for Bulgaria and Latvia and 2021 data for Denmark are not published due to low reliability. 2021 data for Croatia and Slovenia is not displayed due to a break in time series in 2023. 2021 and 2023 data for Germany, Hungary, and Cyprus; 2023 data for Finland, Poland, and Hungary; 2021 data for Ireland should be interpreted with caution as they are affected by some reliability issues.
In 2023, the EU average share of recent VET graduates having experienced work-based learning as part of their studies was estimated target at 64.5% (up by 4.1 percentage points as compared to 2021). At this level, the quantitative target is already met. Considerable cross-country variability persists. In 14 countries the share is estimated below 60% and in 9 at or below 40% (Figure 4. a). As compared to 2021, largest increases are observed for Poland, Greece Ireland, and Estonia (by 10 percentage points or more).
On average, periods of work experience in VET, tend to be long and paid. At EU level, in 2023 38.7% of recent VET graduates had a long work experience as part of their studies, i.e. seven months or more, while 25.8% had a short period of between one and six months (Figure 4. b). Some 41% had a paid work experience, while 23.5% had an unpaid one (Figure 4. c). However, patterns considerably change across- countries.
Figure 4.b - Recent IVET graduates (20-34 years old) with a work-based learning experience as part of their vocational education and training (% of recent VET graduates) by duration of the experience. 2023.

Source: Eurostat, EU LFS. The indicator covers graduates who obtained a VET qualification as their highest at ISCED 3-4 in the last 3 years. The breakdown is distinguished by short work experience (1 to 6 months) and long work experience (7 months or over). NB: Data for Bulgaria, Latvia, and Slovenia are not displayed to low reliability. Data for Germany, Malta, Cyprus, Croatia, Lithuania, Finland, Ireland, Luxembourg, Poland, Portugal, Romania, and Hungary should be interpreted with caution as they are affected by some reliability issues.
Figure 4.c - Recent IVET graduates (20-34 years old) with a work-based learning experience as part of their vocational education and training (% of recent VET graduates), by remuneration of the experience. 2023.

Source: Eurostat, EU LFS. The indicator covers graduates who obtained a VET qualification as their highest at ISCED 3-4 in the last 3 years. The breakdown by remuneration distinguishes paid work experiences and unpaid work experiences. NB: Data for Bulgaria, Latvia, and Slovenia not displayed due to low reliability. Data for Germany, Ireland, Greece, Croatia, Cyprus, Lithuania, Luxembourg, Hungary, Malta, Austria, Poland, Romania, and Finland should be interpreted with caution as they are affected by some reliability issues.
Spain shows the highest share of VET graduates with work-based learning experiences (94%): they largely go through short and unpaid experiences. On the other hand, the Netherlands, Germany, and Austria, but also Denmark, achieve high levels of the target indicator combining long and paid work-based learning experiences, reflecting well-established and attended apprenticeship schemes. Most countries where the overall target indicator is estimated below the EU target tend to have a composition of the work-based learning experiences more oriented towards short work-based learning experiences. These findings can be complemented by how many students in initial VET are enrolled in programmes combining work- and school-based components, as opposed to vocational programmes which are solely, or mainly, school-based. The indicator is defined as the percentage of upper secondary VET students enrolled in combined work- and school-based programmes. In the UNESCO, OECD, Eurostat data collection on formal education (UOE), a vocational programme is classified as combined work-and school-based if between 25% and 90% of the curriculum is presented outside the school environment; otherwise, it is classified as school-based. This definition includes apprenticeships. Using Eurostat data, Cedefop estimates that in the EU, in 2022, 29.8% of upper secondary VET students were enrolled in combined work- and school-based programmes (Figure 4. d). Although comparisons over a more extended period of time are not possible, the value is estimated relatively stable as compared to 2019 (29.4%). This suggests that the prevalence of work-based learning for the EU overall, if measured according to narrower UOE criteria, is well below the estimates from the LFS on recent VET graduates benefiting from work experience. Data on work experience refers to graduates, data on work-based learning refers to students. More importantly, work-based learning is defined more narrowly to capture apprentice type schemes in formal initial VET, which are characterised by structured, paid, mandatory and long term alternance between school and work. There are wide variations across countries in the availability of, and enrolments in, such schemes. Over the period 2015-2022, most countries, participation rates in combined work-and school- based VET have remained stable or increased. Largest increases are observed in Malta, Slovakia, and Romania respectively about a (about 25, 17 and 9 percentage points).
Figure 4.d - IVET students in work-school combined programs as % of all upper secondary IVET. ISCED 3. 2015 and 2022.
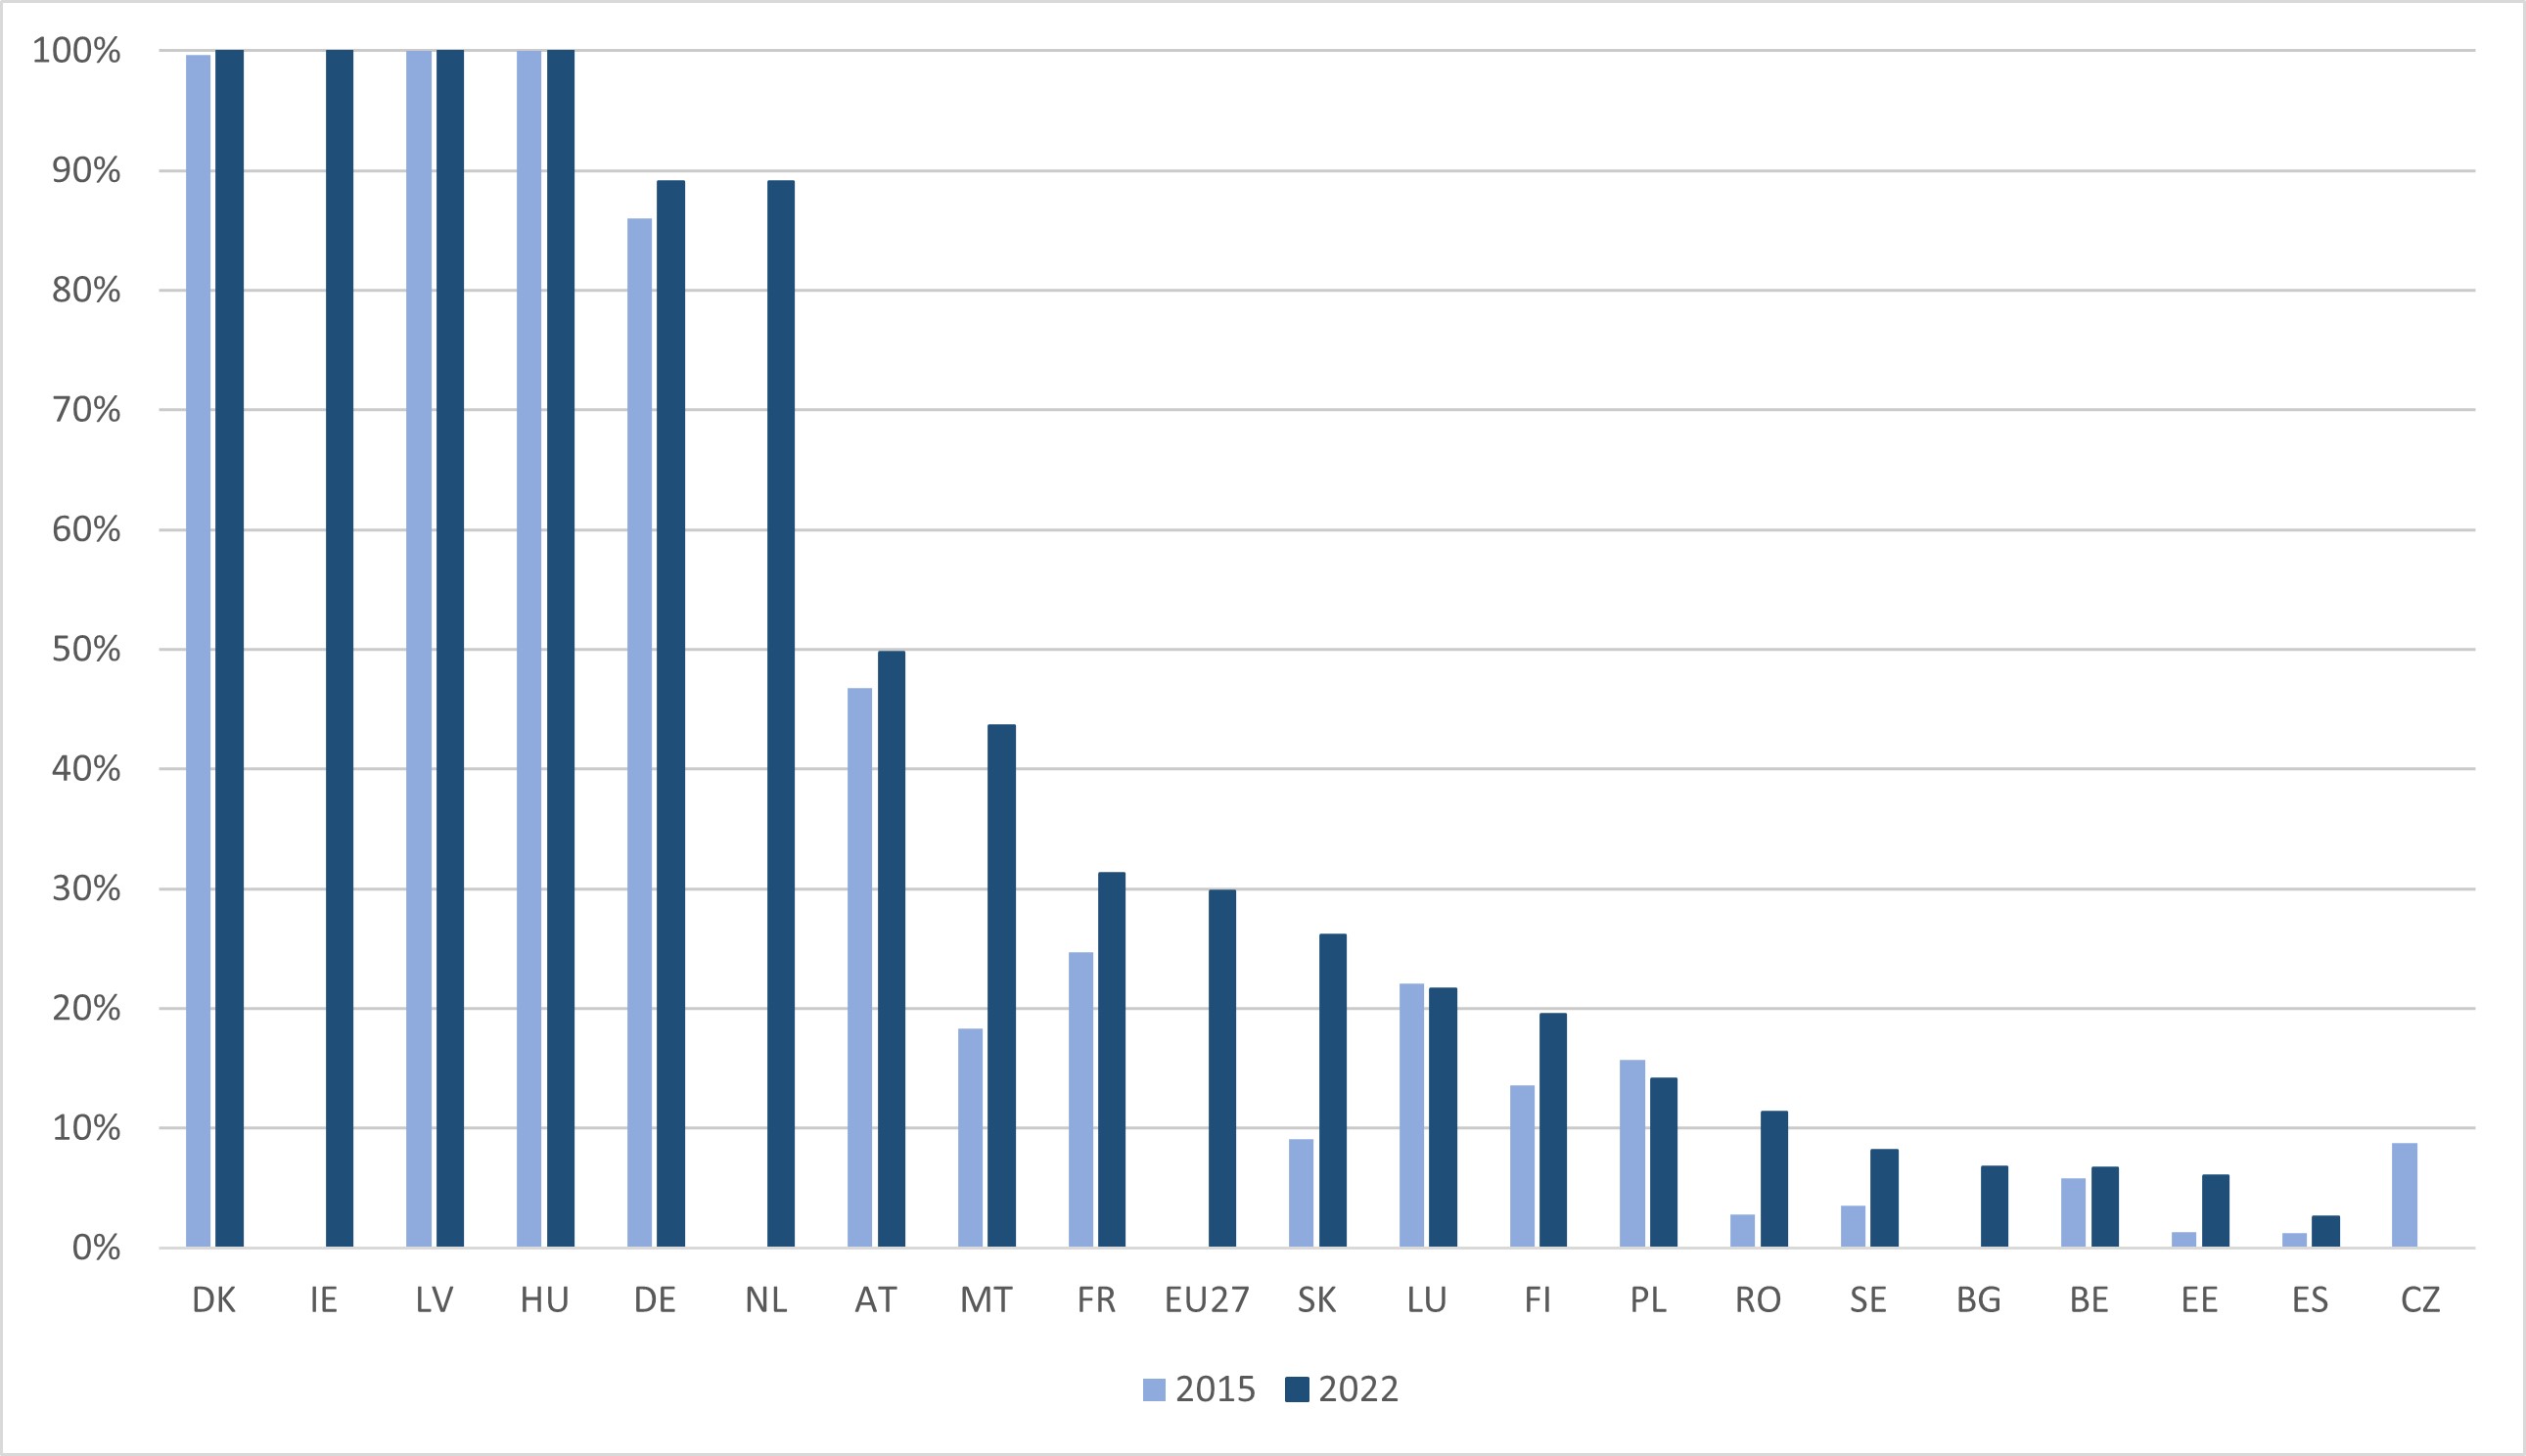
Source: Cedefop calculations, based on Eurostat data, UOE data collection on formal education. EU averages are Cedefop estimations based on available country data. NB: 2015 data for the Netherlands and the EU are not presented due to break in time series. Data for the Netherlands refer to public education only. The distinction between combined work-based and school-based and mainly school-based vocational programmes is not applicable for statistical purposes in the EU member states not displayed in the chart.
Is IVET less attractive for female students?
Gender balance in IVET is particularly important. (Council Recommendation on Vocational Education and Training (2020); European Parliament and Council Recommendation on European Quality Assurance in Vocational Education and Training (2009)).
Figure 5.a - Female IVET students as % of all female upper secondary students. ISCED 3. 2015 and 2022.
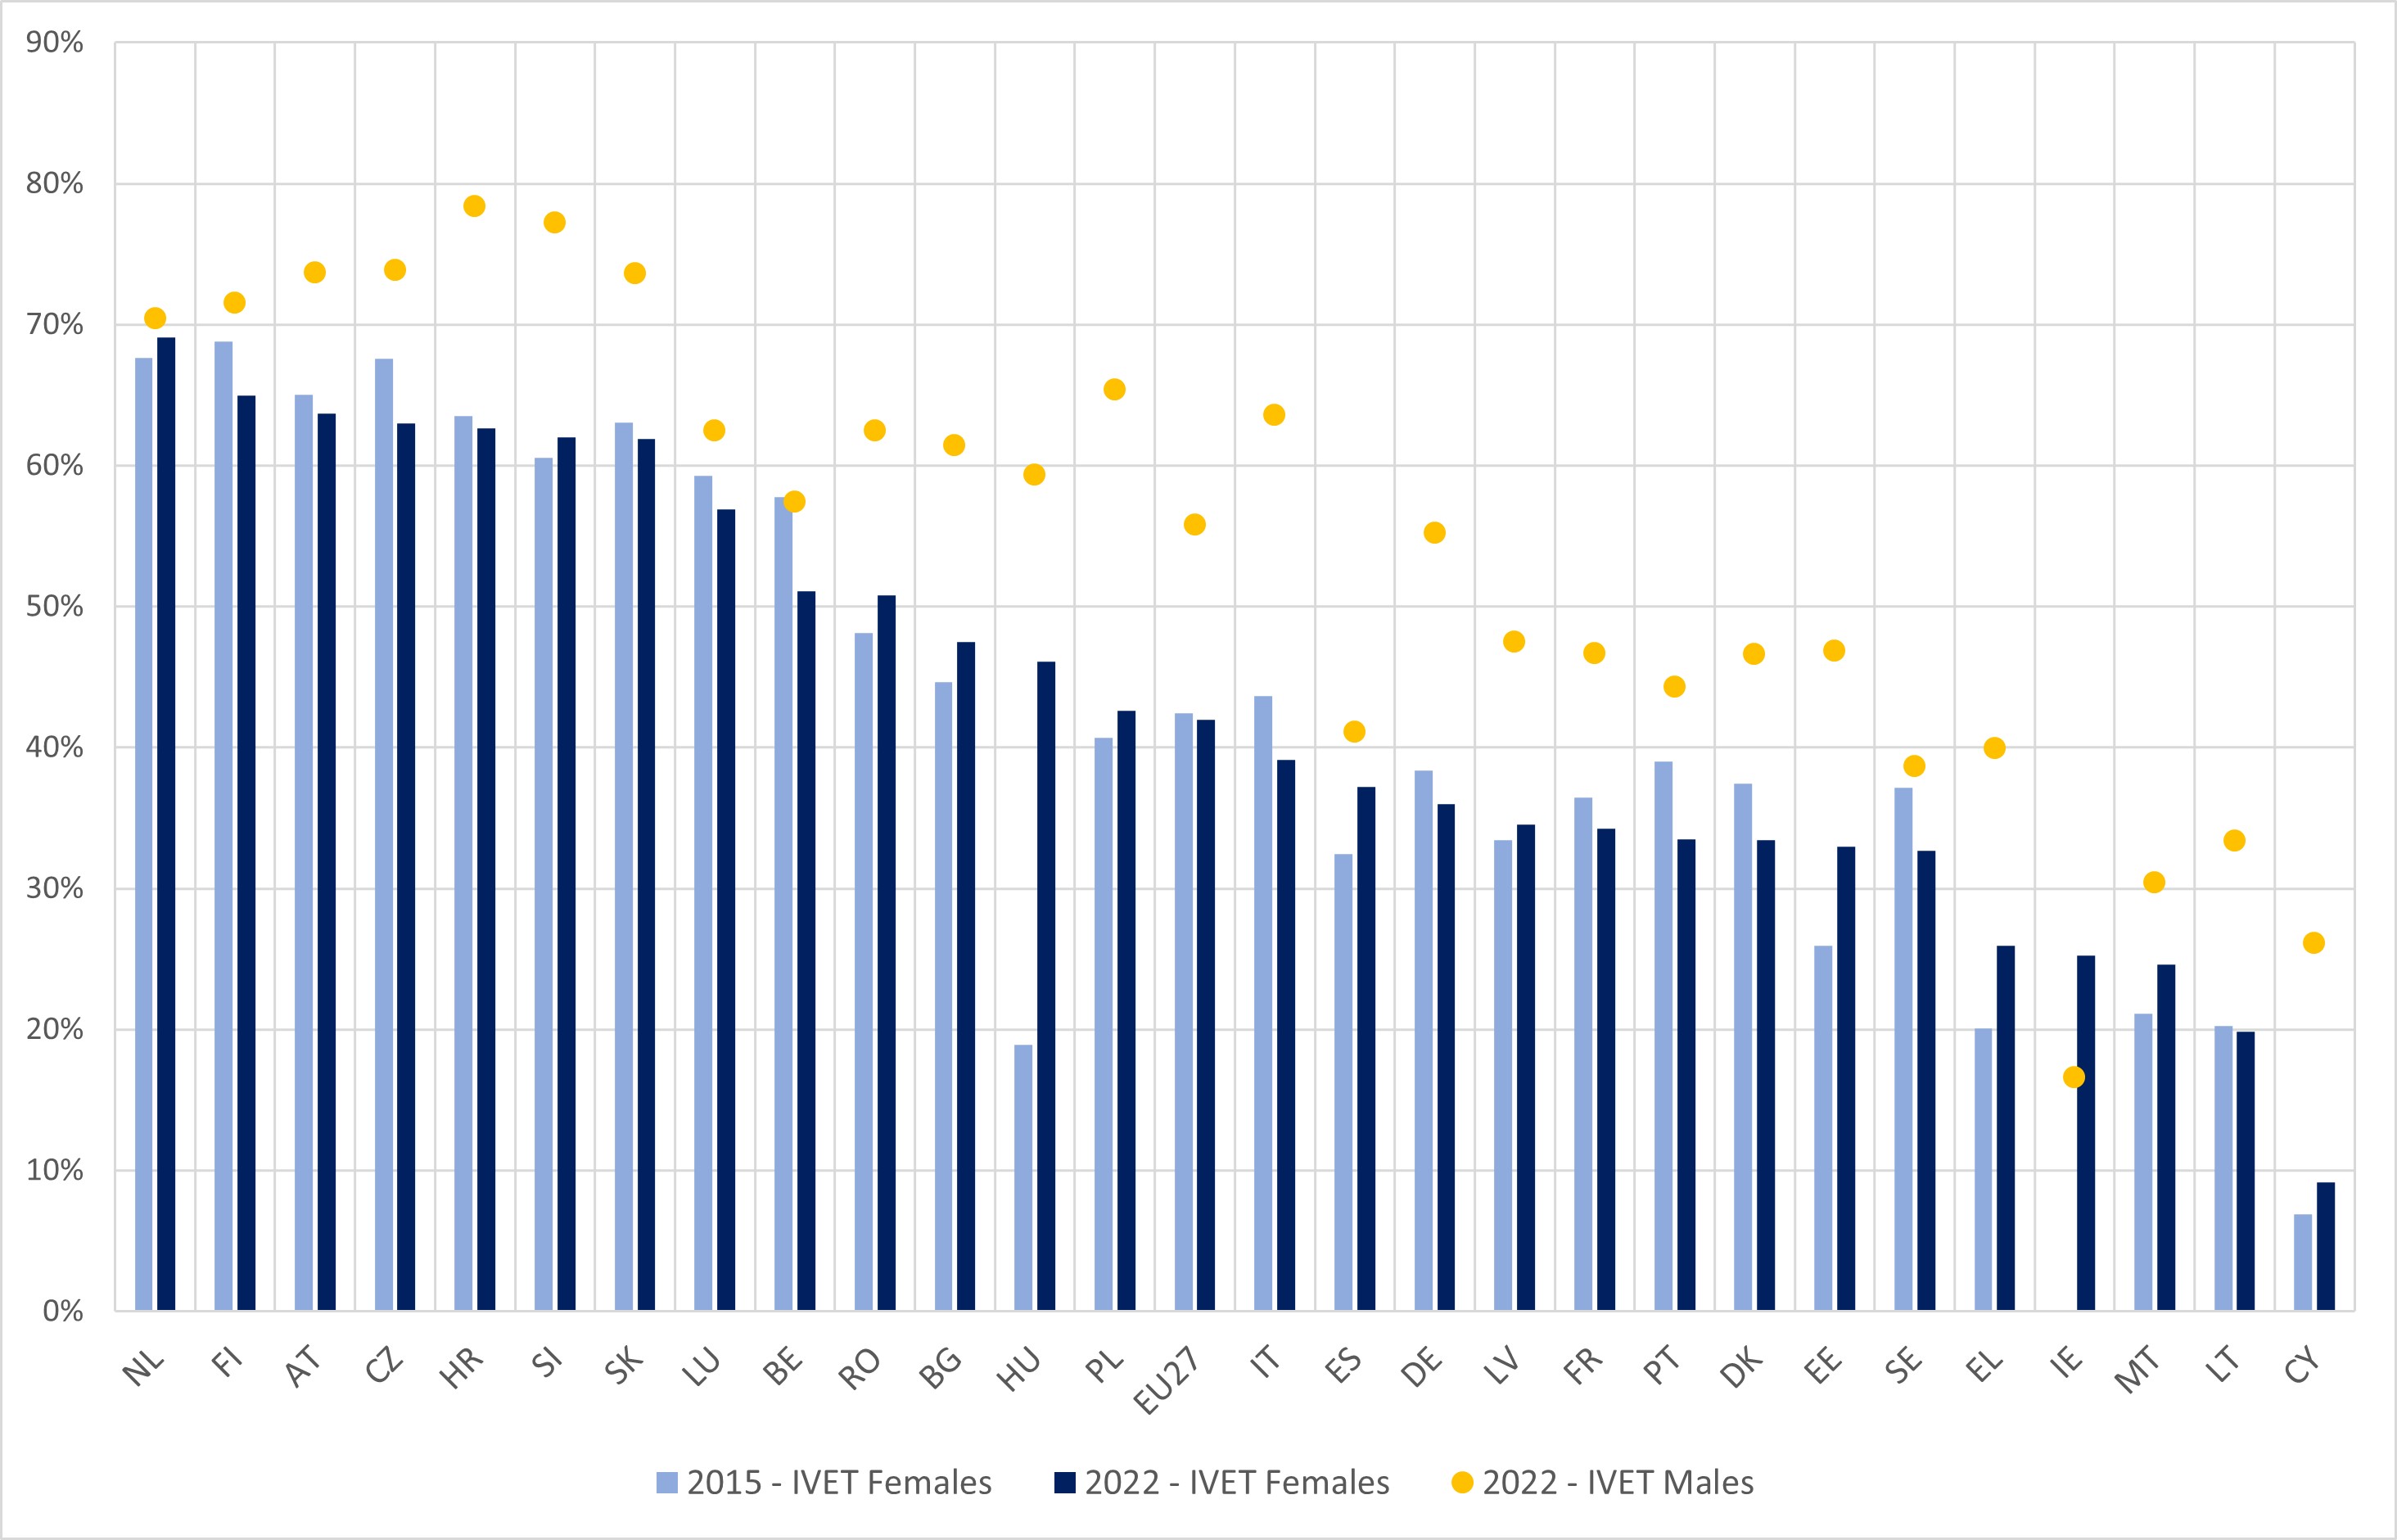
Source: Cedefop calculations, based on Eurostat data, UOE data collection on formal education. NB: 2015 data for Ireland is not available.
In 2022, 49.0% of all upper secondary students in the EU were enrolled in vocational programmes. However, participation in IVET programmes among male students (55.8%) was considerably higher than among female students (41.9%). Although at different levels, this pattern holds in most countries. Based on available data, Italy, Poland, and Germany show the largest gap by gender with participation rates resulting higher for males than for females. Ireland is the only country where the participation rate is higher for females than for males. As compared to 2015, the indicator specified for female students was relatively stable in 2022 (down by 0.5 percentage points). At country level, in most member states changes were of at most +/-5 percentage points. Based on available data, largest increases were observed in Hungary (+27.2 percentage points), Estonia (+7.0) and Greece (+5.8). Largest decreases in female participation were observed in Portugal (-5.5 percentage points) and Belgium (-6.7).
Which skills does IVET supply to the labour market?
In 2022, 2.2 million students graduated from vocational upper secondary education (48.3%, of all upper secondary graduates in the European Union). This is aligned with enrolments patterns at the same ISCED level (49.0%) and reassures that, overall, there are no major differences between enrolments and graduation patterns in VET (as percentages of the corresponding totals). As compared to 2015, a drop by 2.9 percentage points is observed in the share of upper secondary graduates from the vocational stream of education in the EU.
Figure 6.a - IVET graduates (as % of all upper secondary graduates). ISCED 3. 2015 and 2022.

Source: Cedefop calculations, based on Eurostat data, UOE data collection on formal education.
The indicator shows different dynamics over time at country level. In some Member States it went down, in others it went up. In most countries changes were contained between +/- 5 percentage points. Largest decreases (by more than 5 percentage points) were observed in Ireland (-7.2), Belgium (-7.8), Estonia (-10.2), France (-11.5) and Portugal (-16.0). On the opposite side, increases by more than 5 percentage points are observed in Bulgaria (+8.5) and Poland (+8.4), with the latter now reporting indicator values above the EU average.
Looking at the studies followed by initial VET graduates gives insights into the skills they bring into the labour market. Figure 6. b shows the 2022 EU level distribution of upper secondary VET graduates by field of education (as a share of the total number upper secondary VET graduates).
In the EU, in 2022, about 32.7% of all upper secondary graduates from initial VET obtained qualifications in subjects related to engineering, manufacturing and construction (Figure 6. b). With almost a third of the total, this is the field with the highest share of IVET graduates, followed by Business, administration, and law (17.4%). In 2022, 15.1% graduated in in fields related to personal services (including domestic services, hair and beauty services, hotel, restaurants, catering, sports, travel, and tourism and leisure). Health and Welfare together account together for 12.9% of upper secondary graduates in the EU (7.5% and 5.4% respectively). These results reflect an idea of IVET able to expand to service economy and to go beyond the only provision of skills for industry and construction. However, only 4.8% of upper secondary VET graduates in the EU obtained a qualification in Information and Communication Technology.
Figure 6.b - IVET graduates by field of study (% of all upper secondary IVET graduates). ISCED 3. EU27. 2022.

Source: Cedefop calculations, based on Eurostat data, UOE data collection on formal education. NB: ISCED-F 2013 is used to classify data by field of education. ISCED F categories at different level of detail are used to produce the chart. Arts include audio-visual and media production, fashion, interior and industrial design, fine arts, handicraft, music and performing arts. Personal services include domestic services, hair and beauty services, hotel, restaurants, catering, sports, travel, tourism, and leisure services as well as other personal services. The category transport, security, community sanitation, hygiene and occupational health and safety services is considered apart. The category “Other” in the chart includes languages and other humanities relevant for VET.
Based on 2022 data, 38.7% of initial VET students in the EU, graduated in STEM (science, technology, engineering, and maths) related subjects (Figure 6. c). In countries such as Estonia, Hungary, Cyprus, Poland, and Lithuania the share of upper secondary VET graduates in STEM subjects was above 50%. In others, such as Ireland, the Netherlands and Spain it was below 25%. As compared to 2021, the EU average share rose by 0.9 percentage point.
Figure 6.c - STEM graduates from upper secondary IVET (% of all VET graduates). 2021 and 2022.

Source: Cedefop calculations, based on Eurostat data, UOE data collection on formal education. The chart is based on the 2013 ISCED-F classification of fields of study. For the indicator displayed, STEM subjects are considered to be those related to natural Sciences, mathematics, statistics, information and communication technology, engineering, manufacturing, and construction.
The Council Recommendation on Vocational Education and Training (2020) highlights the importance of promoting gender balance in traditionally ‘male’ or ‘female’ professions and address gender related and other types of stereotypes together. Figure 6. d displays the 2022 EU level gender distribution of upper secondary VET graduates by selected fields of study. It shows that female graduates in STEM subjects are very few: engineering (7.1% of the total graduates in the subject), Architecture and Construction (12.6%), ICT (2.5%), Natural Science, Mathematics and Statistics (15.4%). This continues being an issue for raising attractiveness and equity in IVET. On the other hand, there are fields of VET, where graduates tend to be predominantly females such as health (83.1%), welfare (86.6%) and education (96.3%).
Figure 6.d - Female IVET graduates in selected field of education (% of all graduates in the field). ISCED 3. EU27. 2022.
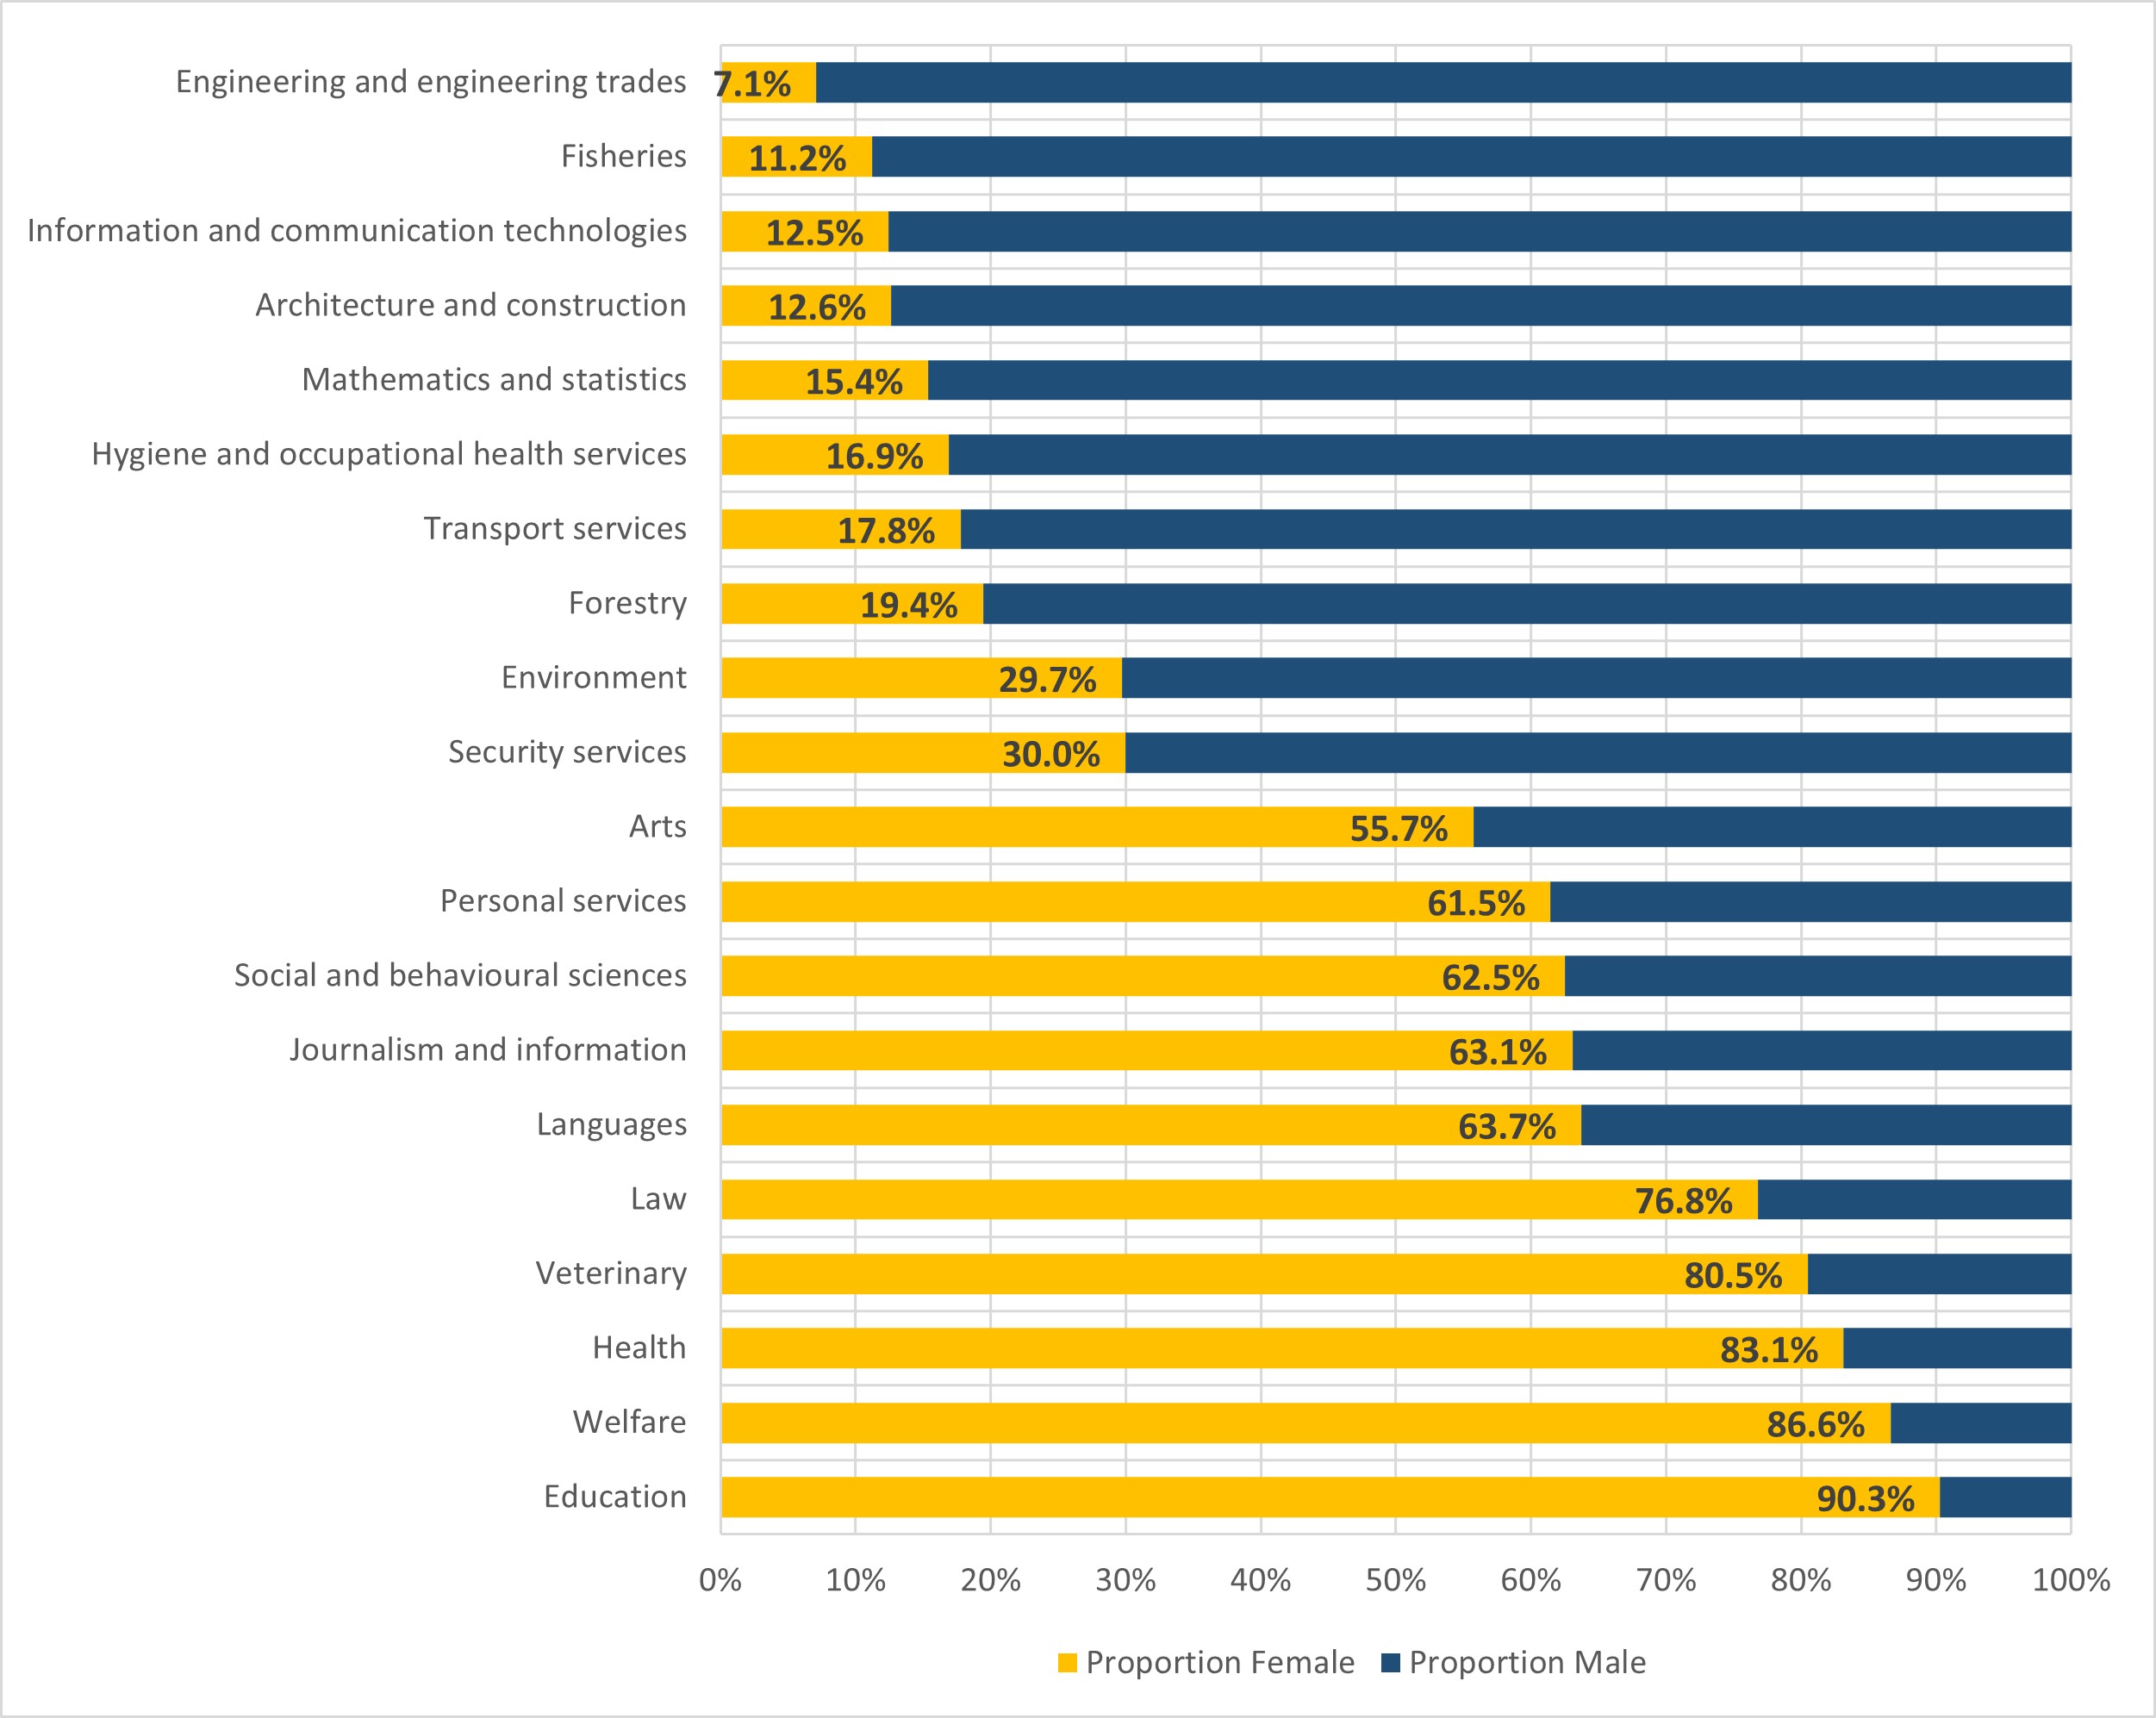
Source: Cedefop calculations, based on Eurostat data, UOE data collection on formal education. ISCED-F 2013 is used to classify data by field of education. Detailed fields are used to produce the chart. Detailed fields with highest and lowest proportions of female graduates are displayed (top and bottom 10 detailed fields).
How many recent VET graduates are employed?
Labour market outcomes and in particular employment rates of IVET graduates are important aspects to consider. The Council Recommendation on Vocational Education and Training (2020) has set a target: by 2025, in the EU, 82% of recent IVET graduate should be employed. Recent VET graduates are defined as young people aged 20 to 34, no longer in education and training, and who obtained a vocational qualification at ISCED level 3-4 as their highest educational attainment in the previous one to three years. Figure 7.a presents 2021 and 2023 employment rate for recent IVET graduates as defined above. It includes 2023 employment rates calculated for their counterparts having recently graduated from general education at ISCED levels 3-4. Indicators are calculated using the same specifications to allow comparisons.
Figure 7.a - Recent IVET graduates (20-34 years old) in employment (%). 2021 and 2023.
Source: Eurostat, EU LFS. NB: the indicator covers graduates at ISCED3-4 and no longer in education and training. There is no available data for general education for Croatia, Luxembourg, Slovenia, and Slovakia. In 2021 Spain and France data does not yet reflect the new EU LFS definition of employment.2022 and 2023 data of Latvia, Cyprus, and Malta, as well as the data for Slovenia in 2023 should be interpreted with caution as they are affected by some reliability issues. Data for Czechia, Slovenia, Bulgaria, and Croatia in 2021 is not displayed due to break in time series.
In 2023, the EU average level of the indicator stood at 81.0% (just one point below the 2025 target). Major differences persist across EU countries. Highest employment rates for recent IVET graduates (at or above 90%) are estimated for Malta, Germany, the Netherlands, and Denmark; lowest values (below 70%) for Italy, Spain, Romania, and Greece. As compared to 2021, the EU average value for the indicator grew by 3.9 percentage points. Among countries for which data can be reliably compared over time, in the period 2021-2023, the indicator went up in almost all countries with the largest increases estimated for Greece and Estonia (by respectively about 17 and 14 percentage points). In Sweden, a drop by 3.9 percentage point is estimated.
Levels and trends of employment rate for recent IVET graduates as displayed above are affected by different labour market conditions in countries. To reduce these effects, it is important to offer some comparisons with distinct levels and orientations of education. Due to sample sizes and the current specification of the indicator, proper comparison is not possible with youngsters with a low level of education having recently obtained their highest qualification. Comparisons are possible with youngsters in the same age group having recently obtained a medium level qualification (ISCED 3-4) of general orientation as their highest and not being in further education or training. In 2023, in the EU, recent IVET graduates had an employment rate 13.4 percentage points higher than their counterparts from the general stream of education (an employment premium of 13.4 percentage points). Overall, the presence of a premium confirms and reassures that, in cases where further learning is not pursued by youngsters, entering the labour market with a vocational qualification at ISCED levels 3-4 combines with better employment prospects than doing so with a general qualification at the same ISCED levels. The presence of a premium is a first straightforward but important signal, about the labour market relevance of IVET, which does not oblige graduates entering the world of work, but it is designed to equip those who wish to do so, with knowledge, skills, competencies and qualification which are more directly or more immediately relevant to enter the labour market. This is not the case for medium level general education, which is instead often and mainly undertaken to prepare for further studies rather for entry into the world of work. Based on available data, and although of different magnitude, this premium is present in almost all EU member states. Exceptions are Ireland, Greece, Finland, and Romania, where the negative differences are not striking.
How much is the public investment on IVET?
Expenditure in IVET is a shared responsibility of public and private actors. The Council Recommendation on Vocational Education and Training (2020) advocates for making best use of European Union funds and stimulate further investments in vocational education and training. According to the Osnabrück Declaration (2020), quality and inclusive VET should provide citizens with equal training opportunities, regardless of their personal and economic background and place of residence.
Figure 8.a displays data on public expenditure in IVET (ISCED 3 and 4) as a percentage of Gross Domestic Product (GDP). In 2021, based on available data, public expenditure on medium level IVET is estimated to amount to an average of 0.53% of GDP across EU countries. Public expenditure varies considerably, ranging from 0.96% of GDP in Belgium and Finland to below 0.30% in Cyprus, Malta, and Lithuania. On average, public expenditure on medium level education (ISCED 3-4) was higher in VET than that in the general stream of education (an estimated difference by 0.03 percentage points for the EU). At different level of magnitude, this holds in most but not all countries for which data are available. In Spain, Romania, France, Lithuania, Malta, and Cyprus, public expenditure is higher on medium level education of general orientation. As compared to 2015, public expenditure on IVET as a share GDP showed different dynamics across countries: in some, it was stable, in others it went up or down. Most changes stood in the range of +/- 0.15 percentage points, except for increases in Romania and Malta and drops in Belgium and Finland where changes were larger than that. An average change of –0.02 percentage points is estimated as compared to 2015.
Figure 8.a - Public expenditure (% of GDP) on IVET. ISCED 3-4. 2015 and 2021.

Source:; Eurostat data, UOE data collection on formal education. EU averages are Cedefop weighted estimations, based on available country data. Weights are derived from Eurostat data on national accounts (GDP at current market prices in millions of euros). NB: Data for Croatia, Italy and Portugal are not available, as well as 2021 data for Ireland and Greece and 2015 data for Denmark and Slovenia. Data for Germany adopt a different definition. To estimate EU averages: a)Croatia, Italy, Portugal, and Ireland were not included due to times series being fully or largely incomplete, b) data for Greece in 2021 and Denmark in 2015 were estimated based on the basis of the closest year in the year in the range 2015-2021; c) 2015, 2016 and 2017 data for Slovenia have been linearly interpolated.
Public expenditure in IVET (ISCED 3-4) can also be made relative to the number of students enrolled (full time equivalent students) and expressed in thousands of purchasing power standards (PPS) to control for different costs of living (Figure 8.b).
In 2021, among countries for which data were available, highest public expenditure on IVET per student was estimated for Luxembourg, Cyprus, Sweden, Austria, Denmark and Belgium (at or above 12 thousand PPS). Lowest values were estimated for Bulgaria, Hungary, Poland and Romania (below 6 thousand). Although to a different extent, most countries spend more for vocational students than they do for their counterparts in general education. Exceptions are found in Malta, Romania, France, and Slovenia (France and Slovenia the differences between vocational and general education are not big).
In most countries for which reliable comparisons over time can be made, public expenditure on IVET per student enrolled went up in the period 2015-2021. Countries that have seen the biggest increase were Lithuania (+4.6 thousand PPS), Luxembourg (+3.1 thousand PPS), and Cyprus (+2.8 thousand PPS). Hungary (-1.9 thousand PPS), Sweden (-1.3 thousand PPS), and Malta (-1.2 thousand PPS) recorded a drop.
Figure 8.b - Annual public expenditure on IVET. ISCED 3-4 per student enrolled. Thousands of purchasing parity standard units (1000 PPS) per student enrolled (full time equivalent student, FTE). 2015 and 2021.

Source: Eurostat data, UOE data collection on formal education. EU averages are Cedefop weighted estimations, based on available country data. Weights were derived from Eurostat data on enrolment in ISCED 3 and 4. VET programmes. NB: Data for Croatia, Italy, and Portugal are not available, as well as 2021 data for Ireland, and Greece and 2015 data for Denmark and Slovenia. Data for Germany adopt a different definition. To estimate EU averages: a) Croatia, Italy, Portugal, and Ireland were not included due to times series being fully or largely incomplete, b) 2020 and 2021 data for Greece as well as 2015 data for Belgium and Denmark were estimated on the basis of the closest year in the range 2015-2021; c) time series for Cyprus, Czechia and Slovenia have been interpolated to fill in partial data gaps.
Data insights details
Downloads
Full article (pdf version): What is new in IVET? Key pointers from statistics