Participation levels for females in initial VET (IVET) are traditionally lower than for males. The indicator below is defined as the number of female upper secondary students (ISCED3) enrolled in IVET programmes, as a percentage of the total number of female upper secondary students. The same indicator, presented below with no gender breakdown, provides a basis for comparison. EU averages are estimated from available country data.
Figure 7. Female IVET students as % of all female upper secondary students
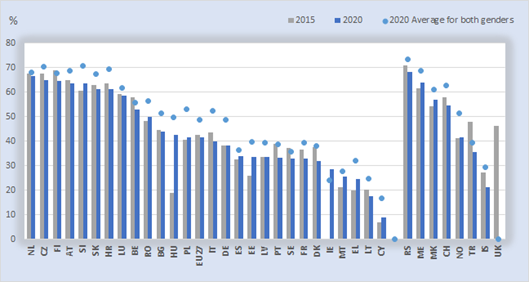
Source: Cedefop calculations based on Eurostat data, UOE data collection on formal education systems.
Key points
In 2020, almost half (48.7%) of all upper secondary students in the EU were enrolled in vocational programmes. Participation among female students was 41.6%. Enrolment of female students in the vocational stream was 50% or more in ten EU Member States. The highest shares (more than 60%) were in the Netherlands, Czechia, Finland, Austria, Slovenia, Slovakia, Croatia. Romania, Bulgaria and Luxembourg had shares between 50% and 60%. Ireland, Malta, Greece, Lithuania, and Cyprus had the lowest shares (at less than 30%). In all, except Ireland, female enrolments in upper secondary IVET were below the corresponding average share calculated for both genders.
Only in Ireland, was participation in upper secondary IVET higher for females than males. Between 2015 and 2020, the indicator dropped by 0.9 percentage points in the EU overall. The largest decreases (over three percentage points) were in Portugal, Denmark, Belgium, Finland, Sweden, Italy and France. The largest increases in female participation were in Hungary (23.7 percentage points) and in Slovenia, Malta, Greece, Estonia (with changes ranging between 3 and 8 percentage points). Among non-EU members, for which 2020 were available, female participation in upper secondary IVET was below 50% in Iceland (21.3%, down by six percentage points as compared to 2015), Norway (41.7%, stable compared to 2015) and Turkey (35.6% and down by 12.2 percentage points as compared to 2015).
Table 7. Female IVET students as % of all female upper secondary students

Source: Cedefop calculations based on Eurostat data, UOE data collection on formal education systems. Notes: (d) ‘definition differs’; data are not presented when they are not available and/or do not support sufficiently reliable comparisons across countries or over time.
Data insights details
Related content