Raising the EU average employment rate for 20- to 64-year-olds to at least 75% was one of the key targets of the Europe 2020 strategy to which VET was called to contribute.
The indicator below is the percentage of the population aged 20 to 64 who are employed. The employed population consists of those who, during the reference week, did any work for pay or profit for at least one hour, or were not working but had jobs from which they were temporarily absent.
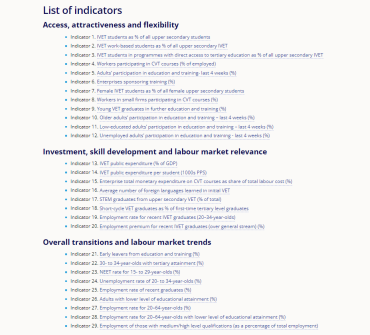
Employment rate for 20–64-year-olds (%)

Source: Eurostat, EU Labour Force Survey (LFS).
Key points
In 2020, the EU average employment rate for those aged 20 to 64 was 72.3%, 3.7 percentage points below its target of 75%. Sweden had the highest employment rate at 80.8%, followed by Germany and Netherlands (80.0%, both). The rate was the lowest in Greece (61.1%) and Italy (62.6%).
Several countries had national targets for the employment rate of 20- to 64-year-olds. By 2020, 14 countries had reached their national target (Czechia, Germany, Estonia, Croatia, Hungary, Latvia, Lithuania, Malta, Netherlands, Poland, Romania, Slovenia, Slovakia, and Sweden). Between 2015 and 2020, the EU average employment rate increased by 3.3 percentage points. The increase was greatest in Malta, Cyprus, Bulgaria, Croatia, Greece and Hungary (6 percentage points or more). The smallest increases were in Austria and Luxembourg (+1.2%, both). A break in time series for data for 2020 for Belgium, Denmark, Germany, Ireland and Sweden means that they cannot be reliably compared with data for 2015. Among the non-EU countries for which data were available, Turkey (51.0%) and North Macedonia (59.1%) had the lowest employment rates (however below the one observed for Greece), while Switzerland (82.5%) and Iceland (82.3%) had an employment rate higher than any of the EU Member States. During the 2015-2020 interval, the highest increase was in Serbia and North Macedonia (+9.9% and +7.2%, respectively), while Turkey experienced a contraction of 2.9 percentage points.
Table 27. Employment rate for 20–64-year-olds (%)

Source: Eurostat, EU Labour Force Survey (LFS). Notes: (b) ‘break in time series’; (p) provisional’; (T): not defined; data are not presented when they are not available and/or do not support sufficiently reliable comparisons across countries or over time.
Data insights details
Related content