Demographic trends, technological change and an ageing workforce make it likely that older people will need to broaden and update their skills to meet labour market challenges. This means an increased need for lifelong learning, to which VET should contribute.
The indicator below is defined as the percentage of older adults (aged 50 to 64) who participated in education or training in the four weeks prior to the survey; it is a measure of lifelong learning among older adults.
Older adults’ participation in education and training – last 4 weeks (%)

Source: Cedefop calculations based on Eurostat data, EU Labour Force Survey (LFS).
Key points
In 2020, in the EU, 5.6% of older adults (aged 50 to 64) participated in education and training in the four weeks prior to the survey, compared to 9.2% for all adults. Nordic countries – Sweden (21.5%), Finland (19.3%) and Denmark (14.3%) – reported the highest shares. Those three countries also had the highest participation rates of adults aged 25 to 64 in lifelong learning in 2020. Participation of older adults in lifelong learning was lowest in Romania and Croatia (below 1%, flag indicates low reliability of estimates for Croatia).
In the EU overall, participation in lifelong learning among older adults fell by 0.7 percentage points between 2015 and 2020 due to a fall in 2020, which reversed the progress made until 2019. Nevertheless, the indicator rose went in this period in some countries, including in 2020. The biggest increase was in Estonia (5.3 percentage points). Break in time series occurred in Belgium, Denmark, Germany, Ireland, Malta, Poland and Sweden, so their data for 2020 cannot be compared reliably with those for 2015.
Among non-EU countries, Switzerland (20.0%), Iceland (13.0%) and Norway (10.0%) had 2020 participation levels higher than the EU average, A break in time series means that data for Iceland cannot be compared reliably). Switzerland had a noticeable reduction of 5.4 percentage points in participation between 2015 and 2020.
Table 10. Older adults’ participation in education and training – last 4 weeks (%)
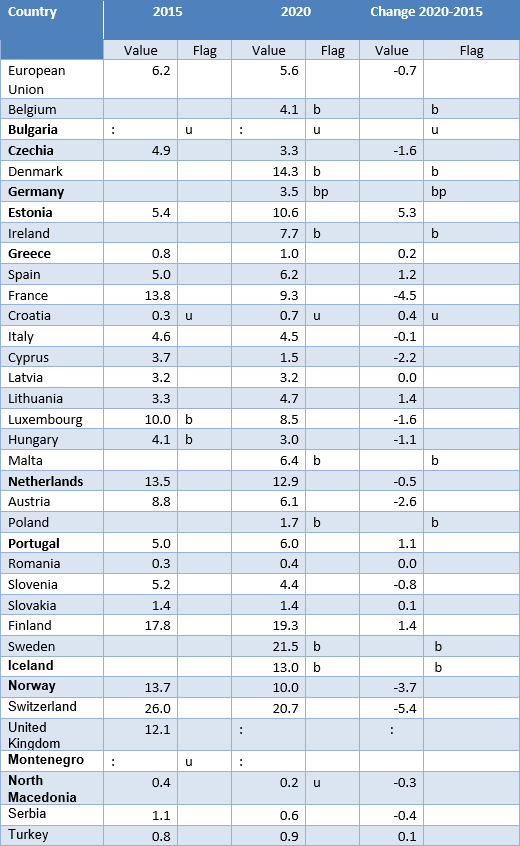
Source: Cedefop calculations based on Eurostat data, EU Labour Force Survey (LFS). Notes: (b) ‘break in time series’; (p) ‘provisional’ (u) ‘unreliable’; data are not presented when they are not available and/or do not support sufficiently reliable comparisons across countries or over time.
Data insights details
Related content