European and national policies on Vocational Education and Training (VET) need to be informed by sound and internationally comparable statistical evidence. The VET country statistical overviews are concise, descriptive and user friendly statistical reports. For each country, they quantify and compare key aspects of VET and lifelong learning. The selection is based on the indicators' policy relevance and their importance in achieving the Europe 2020 objectives.
VET indicators for the Norway for the last available year
Index numbers (EU=100)
 NB: The index numbers are derived from data summarised in the table. Data in the table have been rounded to one or two decimal places. The calculation of index numbers is instead based on not rounded data.
Norway’s performance on a range of indicators selected to monitor progress in VET and lifelong learning across the European Union (EU) is summarised below. The chart compares the situation in Norway with that of the EU, based on the most recent data available (this differs by indicator). Data in the chart are presented as an index where the EU average equals 100. If the index for a selected indicator for Norway is 100, then its performance equals the EU average. If the index is 90, its performance is 90% of (or 10% below) the EU average. If the index is 200, Norway’s performance is twice (or 200%) the EU average. For some indicators, such as early leavers from education and training, a country is performing better if its score is below that of the EU average.
Data on which the index is calculated are presented in the table, which also shows developments over time. A technical definition of each indicator is provided in the annex.
Key points
Access, attractiveness and flexibility
The percentage of upper secondary students in IVET (50.1% in 2015) is a higher than the EU average (47.3%). The same indicator for female upper secondary students in IVET is slightly below the EU average (41.2% in Norway and 42.0% across the EU). Students in combined work- and school-based programmes accounted for 31.7% of students in upper secondary IVET, which is above the EU estimated average of 28.4%.
For several other indicators, the values for Norway are markedly higher than EU averages. The percentage of adults participating in lifelong learning (19.6%) is nearly twice the EU average (10.8%, data for 2013). Older adults, the unemployed, and those with relatively low qualifications are all much more likely to participate in lifelong learning than is the case across the EU (based on 2016 data). Data for 2011 show that non-formal education and training is nearly exclusively job-related (91.9% compared with 80.2% across the EU).
The share of individuals who want to participate in training but who do not do so is lower in Norway (7.4%) than in the EU as a whole (9.5% in 2011).
Skill development and labour market relevance
Data from 2014 show that public expenditure on IVET as a percentage of GDP is higher in Norway (0.70%) than in the EU (0.54%). The average expenditure per student, at 12 100 purchasing power standard (PPS) units, is considerably higher than the 8 400 PPS units in the EU. The percentage of graduates in STEM subjects from upper secondary VET (at 34.3%) is above the EU average (30.8% in 2015). The percentage of innovative enterprises with supportive training practices is much higher than in the EU (60.0% versus 44.8% in the EU, based on data for 2014).
The employment rate for IVET graduates (aged 20-34) at ISCED levels 3-4 (88.0%) is higher than EU average (78.1%). Their employment rate is 5.4 percentage points higher than for graduates from general education (this is close to the EU average premium of 5.7). The rate is also 24.6 percentage points higher than for graduates with lower-level qualifications (close to the EU average premium of 23.4). These employment figures relate to 2016 and exclude young people in further education and training.
Overall transitions and labour market trends
In this section all data refer to 2016 unless otherwise stated.
The percentage of early leavers from education and training in Norway (10.9%) is near the EU average (10.7%). But the share of 30 to 34 year-olds who have completed tertiary-level education (50.1% compared to the EU average of 39.1%) is significantly higher. The same is true of the employment rate for 20 to 64 year-olds (78.6% for Norway, 71.0% for the EU).
The NEET rate for 18 to 24 year-olds (7.4%) is much lower than the EU rate (15.2%). Similarly, the unemployment rate for 20 to 34 year-olds (6.8%) is lower than the EU average (11.8%). The employment rate of 20 to 64 year-olds with a low level of educational attainment is higher in Norway (60.3%) than in the EU (53.6%), but has decreased by 4.0 percentage points since 2010.
Score on VET indicators in Norway and in the EU, 2010,
last available year and recent change
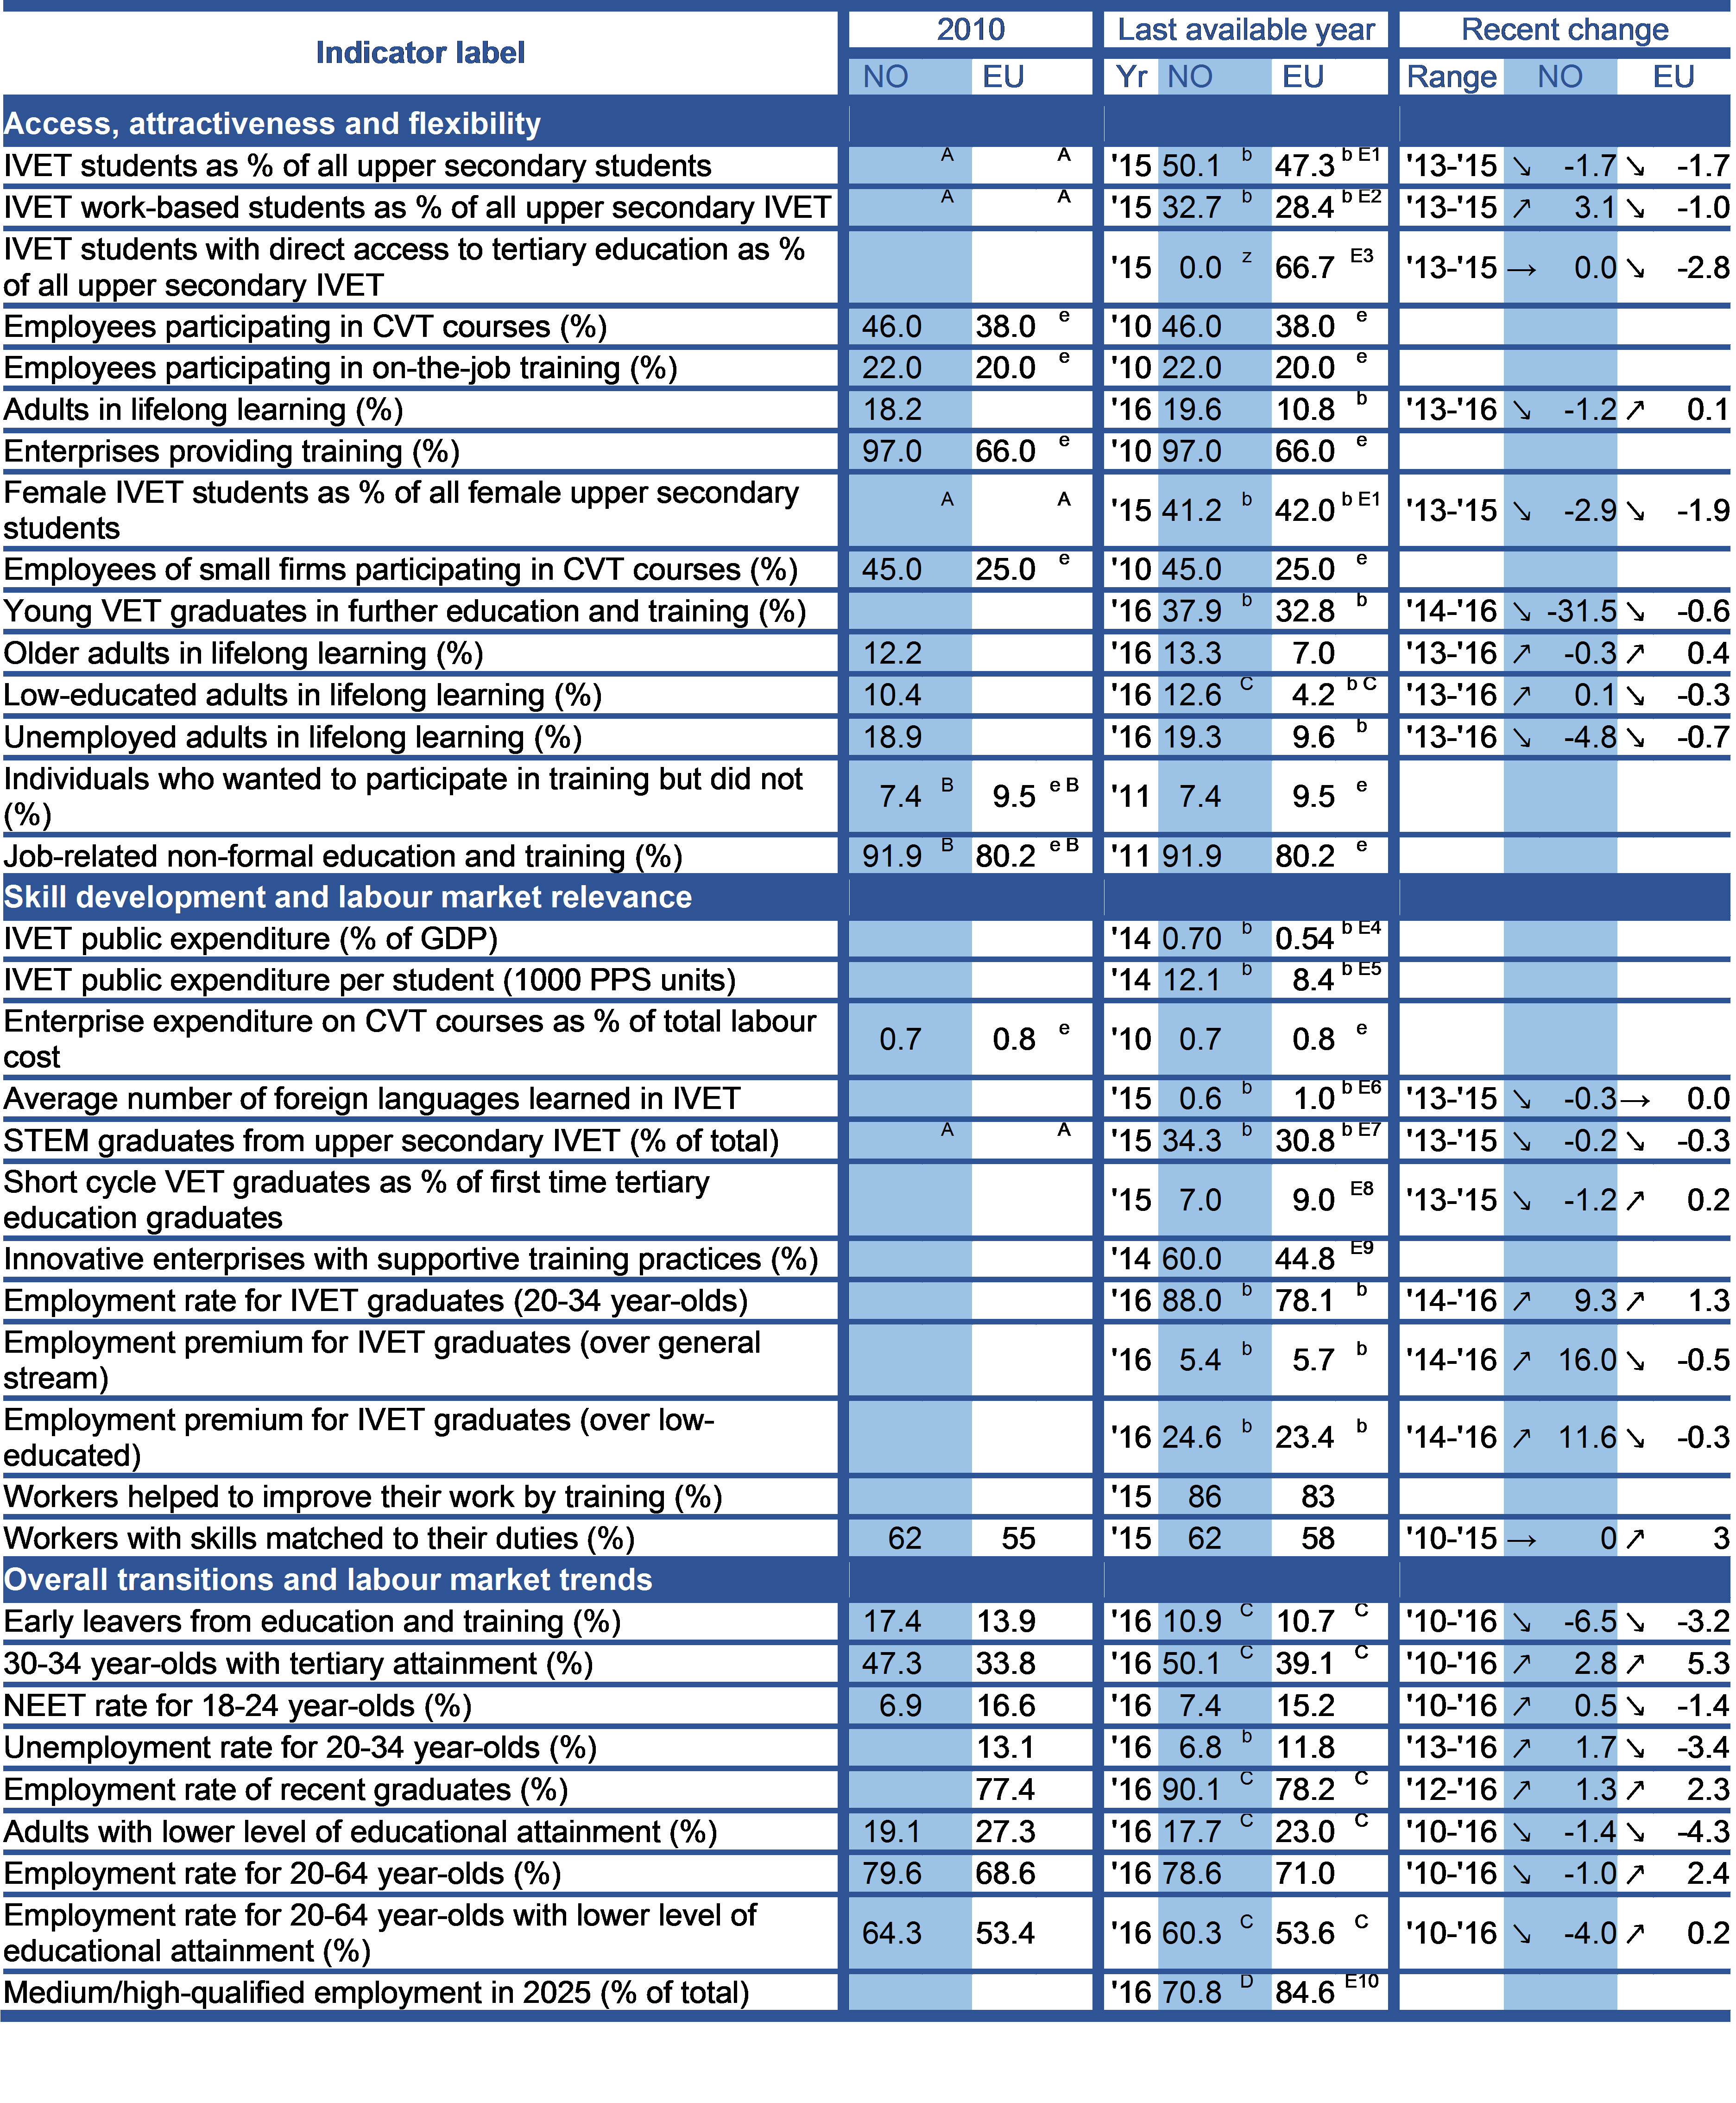
EU refers to EU-28, unless otherwise specified. Arrows ↗ or ↘ signal a positive or negative change. Arrow → indicates: no change.
(A) UOE back reconstruction of 2010 values based on ISCED 2011 not yet available. (B) AES 2011, used as proxy for 2010 baseline. (C) 2014 b flags in Eurostat online tables ignored on the basis of other relevant Eurostat metadata. (D) Forecast made in 2016. (E1) Based on 28 countries, with partial information for NL. (E2) Based on 28 countries, with partial information for EL, ES, NL, PL, RO. (E3) Based on 28 countries, with partial information for IT, NL. (E4) Based on 23 countries (missing: DK, EL, HR, IT, PT), with partial information for IE and FR. (E5) Based on 23 countries (missing: DK, EL, HR, IT, PT), with partial information for IE and FR. (E6) Based on 28 countries, with partial information for DK, EL, NL. (E7) Based on 25 countries (missing: HR, IT, UK), with partial information for BE, CZ, DK, DE, EE, EL, LU, NL, PL, SE. (E8) Based on 25 countries (missing: IE, FR, UK), with partial information for BE, EL, LU. (E9) Based on 26 countries (missing: IE, UK), with partial information for DK, DE. (E10) Based on 28 countries. (b) Break after 2010, therefore baseline data not included. (u) Eurostat: ‘low reliability’. (z) Eurostat: ‘not applicable’. (e) Eurostat: ‘estimated’.
Country-specific report details
