European and national policies on Vocational Education and Training (VET) need to be informed by sound and internationally comparable statistical evidence. The VET country statistical overviews are concise, descriptive and user friendly statistical reports. For each country, they quantify and compare key aspects of VET and lifelong learning. The selection is based on the indicators' policy relevance and their importance in achieving the Europe 2020 objectives.
VET indicators for the Netherlands for the last available year
Index numbers (EU=100)

NB: The index numbers are derived from data summarised in the table. Data in the table have been rounded to one or two decimal places. The calculation of index numbers is instead based on not rounded data.
The performance of the Netherlands on a range of indicators selected to monitor progress in VET and lifelong learning across the European Union (EU) is summarised below. The chart compares the situation in the Netherlands with that of the EU, based on the most recent data available (this differs by indicator). Data in the chart are presented as an index where the EU average equals 100. If the index for a selected indicator for the Netherlands is 100, then its performance equals the EU average. If the index is 90, its performance is 90% of (or 10% below) the EU average. If the index is 200, the performance of the Netherlands is twice (or 200%) the EU average. For some indicators, such as early leavers from education and training, a country is performing better if its score is below that of the EU average.
Data on which the index is calculated are presented in the table, which also shows developments over time. A technical definition of each indicator is provided in the annex.
Key points
Access, attractiveness and flexibility
The percentage of IVET students in upper secondary education in the Netherlands (68.5%) is higher than the EU average (47.3% in 2015). Among the students who are working towards a vocational qualification in the Netherlands, 21.3% are engaged in combined work- and school-based programmes (in the EU this is 28.4%). The share of students of upper secondary IVET enrolled in programmes providing direct access to tertiary education (47.2%) is markedly below the EU average (66.7%). VET graduates are more likely to continue in further education and training (49.0%) than in the EU (32.8%, data for 2016).
Participation of adults in lifelong learning is relatively high at 18.8% compared with 10.8% in the EU (data for 2016). Older adults are also more likely to participate in lifelong learning (13.4% versus 7.0% in the EU), as are lower-educated people (9.1% versus 4.2% in the EU), and the unemployed (18.1% versus 9.6% in the EU).
Skill development and labour market relevance
Levels of expenditure on vocational education and training (IVET and CVET) are relatively high in the Netherlands. The level of expenditure on IVET, at 0.76% of GDP, is higher than the EU average of 0.54%. The average level of expenditure per student at 10 700 purchasing power standard (PPS) units is higher than the EU average of 8 400 PPS units. Expenditure on CVT by enterprises – as a percentage of labour costs – is relatively high at 1.2% compared to 0.8% in the EU (data drawn from CVTS 2010).
A relatively high percentage of those aged 20 to 34 graduating from the VET stream at medium education level are likely to be in employment (85.5% compared with 78.1% in the EU). The employment rate for IVET graduates (aged 20-34) at ISCED levels 3-4 is 8.2 percentage points higher than for graduates from general education (this is above the corresponding EU average premium of 5.7); their employment rate is also 21.9 percentage points higher than for graduates with lower-level qualifications (the corresponding EU average premium is 23.4). All these employment figures relate to 2016 and exclude young people in further education and training.
Overall transitions and labour market trends
In this section all data refer to 2016 unless otherwise stated.
The percentage of early leavers from education and training at 8.0% is lower than the EU average of 10.7%. It is also below the Europe 2020 average target of 10%, and exactly at the national target of 8%. The percentage of 30 to 34 year-olds who have achieved tertiary-level education is higher than the EU average: 45.7% in the Netherlands versus 39.1% in the EU. This is higher than the national target and the Europe 2020 average target (both at 40%).
The percentage of young people who are NEET at 6.1% is much lower than the EU average of 15.2%, and the employment rate of recent graduates (90.1%) is higher than in the EU (78.2%). The employment rate of 20 to 64 year-olds with a low level of educational attainment is higher in the Netherlands (60.7%) than in the EU (53.6%).
Score on VET indicators in the Netherlands and in the EU, 2010,
last available year and recent change
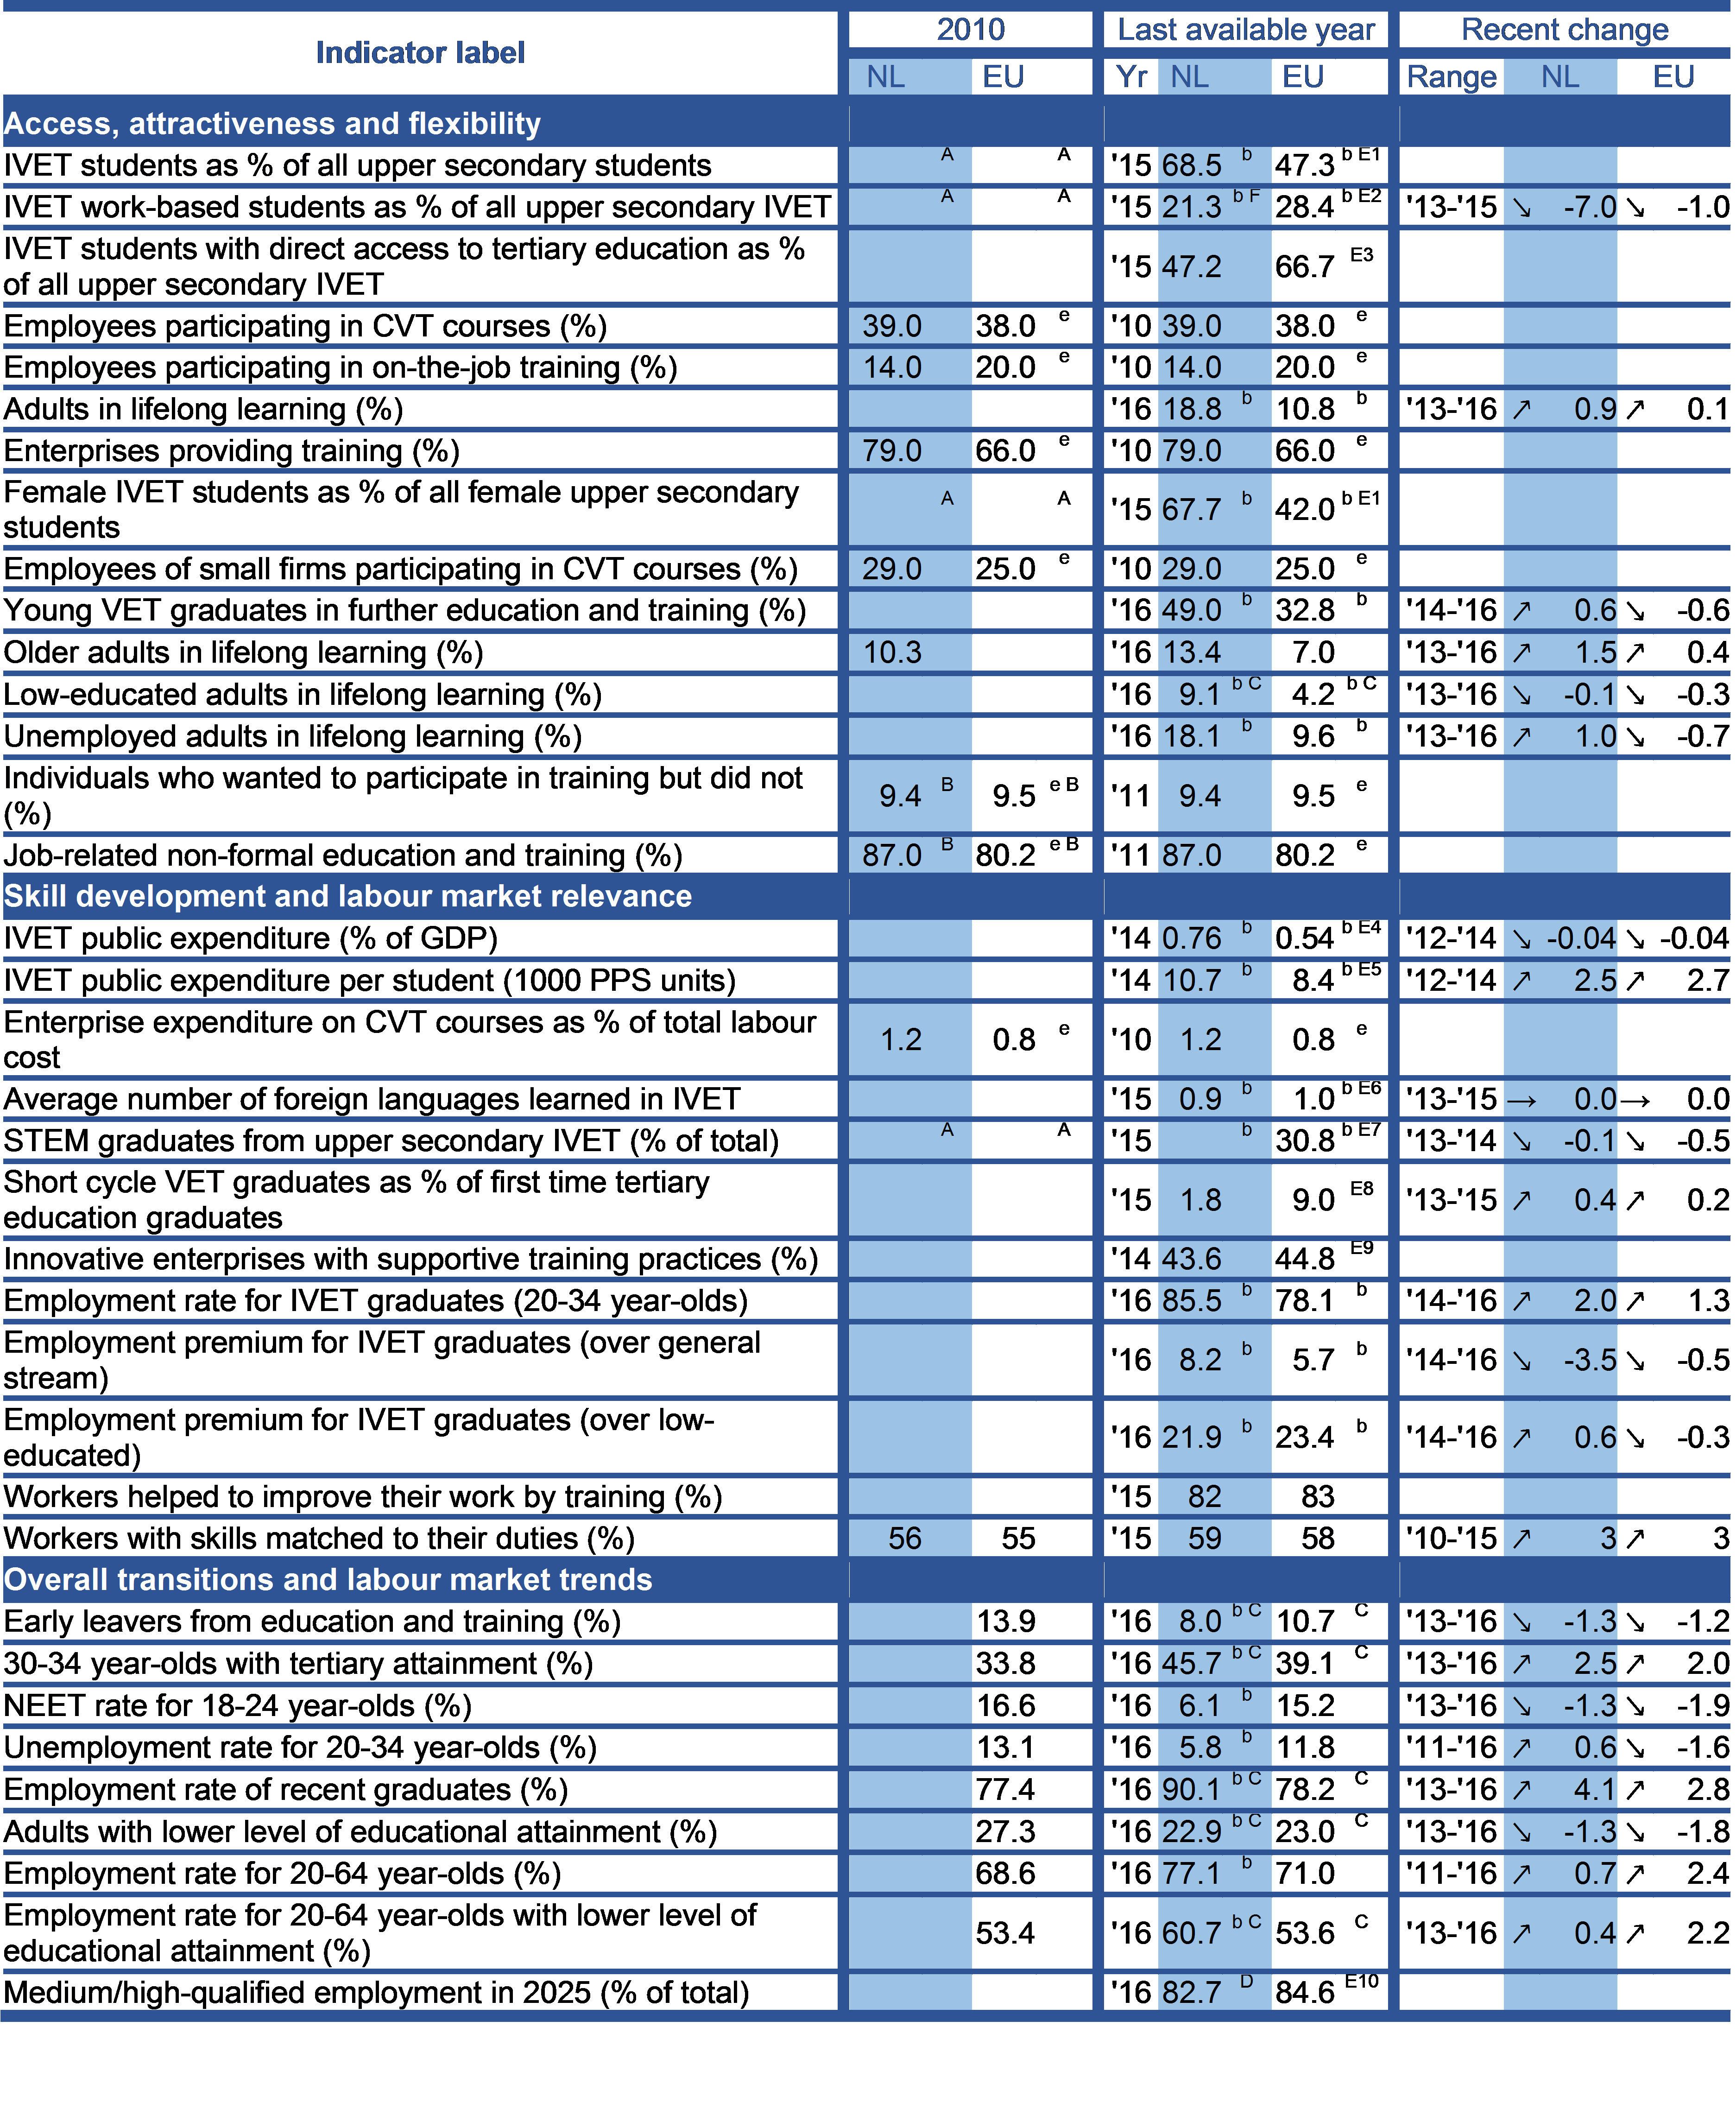
EU refers to EU-28, unless otherwise specified. Arrows ↗ or ↘ signal a positive or negative change. Arrow → indicates: no change.
(A) UOE back reconstruction of 2010 values based on ISCED 2011 not yet available. (B) AES 2011, used as proxy for 2010 baseline. (C) 2014 b flags in Eurostat online tables ignored on the basis of other relevant Eurostat metadata. (D) Forecast made in 2016. (E1) Based on 28 countries, with partial information for NL. (E2) Based on 28 countries, with partial information for EL, ES, NL, PL, RO. (E3) Based on 28 countries, with partial information for IT, NL. (E4) Based on 23 countries (missing: DK, EL, HR, IT, PT), with partial information for IE and FR. (E5) Based on 23 countries (missing: DK, EL, HR, IT, PT), with partial information for IE and FR. (E6) Based on 28 countries, with partial information for DK, EL, NL. (E7) Based on 25 countries (missing: HR, IT, UK), with partial information for BE, CZ, DK, DE, EE, EL, LU, NL, PL, SE. (E8) Based on 25 countries (missing: IE, FR, UK), with partial information for BE, EL, LU. (E9) Based on 26 countries (missing: IE, UK), with partial information for DK, DE. (E10) Based on 28 countries. (b) Break after 2010, therefore baseline data not included. (u) Eurostat: ‘low reliability’. (z) Eurostat: ‘not applicable’. (e) Eurostat: ‘estimated’.
Country-specific report details
