The EU level developments
In 2019 EU employment reached a peak with almost 200 million jobs. A growing population and economic growth resulted in a net increase of more than 12 million jobs since 2011.
Inevitably, the Covid-19 pandemic interrupted the positive trends. In 2020, more than 2.5 million jobs were lost. Unemployment increased, the share of young people not in employment, education, or training (NEET) rose, and fewer adults took part in education and training (see Figure 1).
Figure 1: Key labour market indicators development
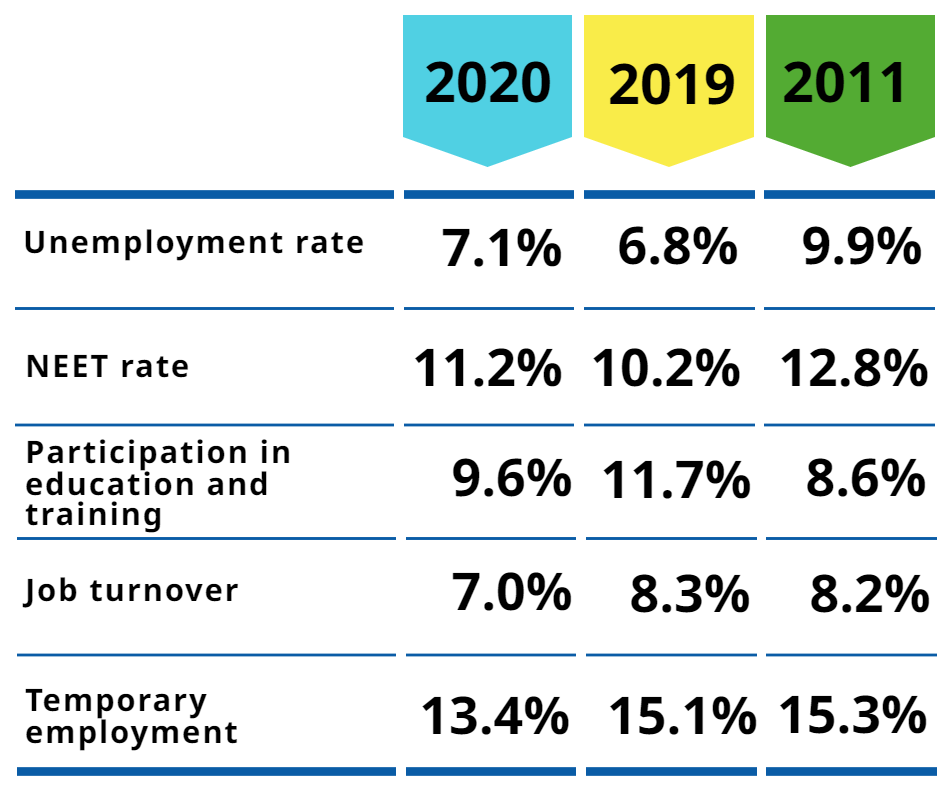
Source: Skills intelligence indicators based on EU LFS data. Own calculations.
While 2021 averages are still being processed, analysis of monthly developments shows that key labour market indicators are likely to improve. For example, the seasonally adjusted monthly unemployment rate in December 2021 dropped to 7%, the lowest since the height of the economic boom prior to the great financial crisis.
Given the unprecedented challenges the health crisis brought about, its impact on employment and jobs appears to be less severe than many people feared. The unemployment and NEET rates have only grown slightly. Participation in education and training was more severely affected and fell back to its 2013 level.
Job turnover (the share of people who start a new job during a given year) declined significantly. As a result of increased uncertainty, more people stayed in their jobs even if they were not satisfied. With many organisations facing challenges, they were not prepared for, and a gloomy outlook in sectors directly hit by the pandemic, employers had to focus on adapting to new circumstances and many stopped or greatly reduced hiring new staff. Job turnover declined most for service and sales workers and manual workers in industry and construction; the decline in job turnover for professional jobs was much less pronounced[i].
The share of people with temporary contracts declined and the share of people who report having temporary contracts involuntarily did not grow[ii]. Although more evidence needs to be collected on this, it seems likely that people with temporary contracts were big victims of the crisis and these jobs have been cut disproportionally to those with indefinite job contracts. Cedefop Skills-OVATE analysis of online job advertisements (OJAs) shows similar trends. The share of OJAs offering temporary and indefinite contracts changed only marginally between 2019 and 2020.
Perhaps the most striking labour market trend is the significant increase of people usually working from home. It reached over 12% in 2020. This growth was mostly driven by employees, where the share of people reporting to work from home almost quadrupled (from 3% in 2019 to almost 11% in 2020). For self-employed people, a group where working from home was much more common before the pandemic, the share moderately increased from 19% to 22%.[iii]
National developments
Of the 29 countries covered by this analysis (the 27 EU Member States plus Iceland and Norway), only Malta, Luxembourg, and Cyprus saw their employment grow. In 8 countries (e.g., Netherlands, Poland, or Slovenia) the employment decline amounted to less than 1% and in only 4 countries (Estonia, Spain, Iceland, and Bulgaria) employment fell by more than 2% (see Figure 2).
Figure 2: Employment change in Europe (2020 to 2019, in %)
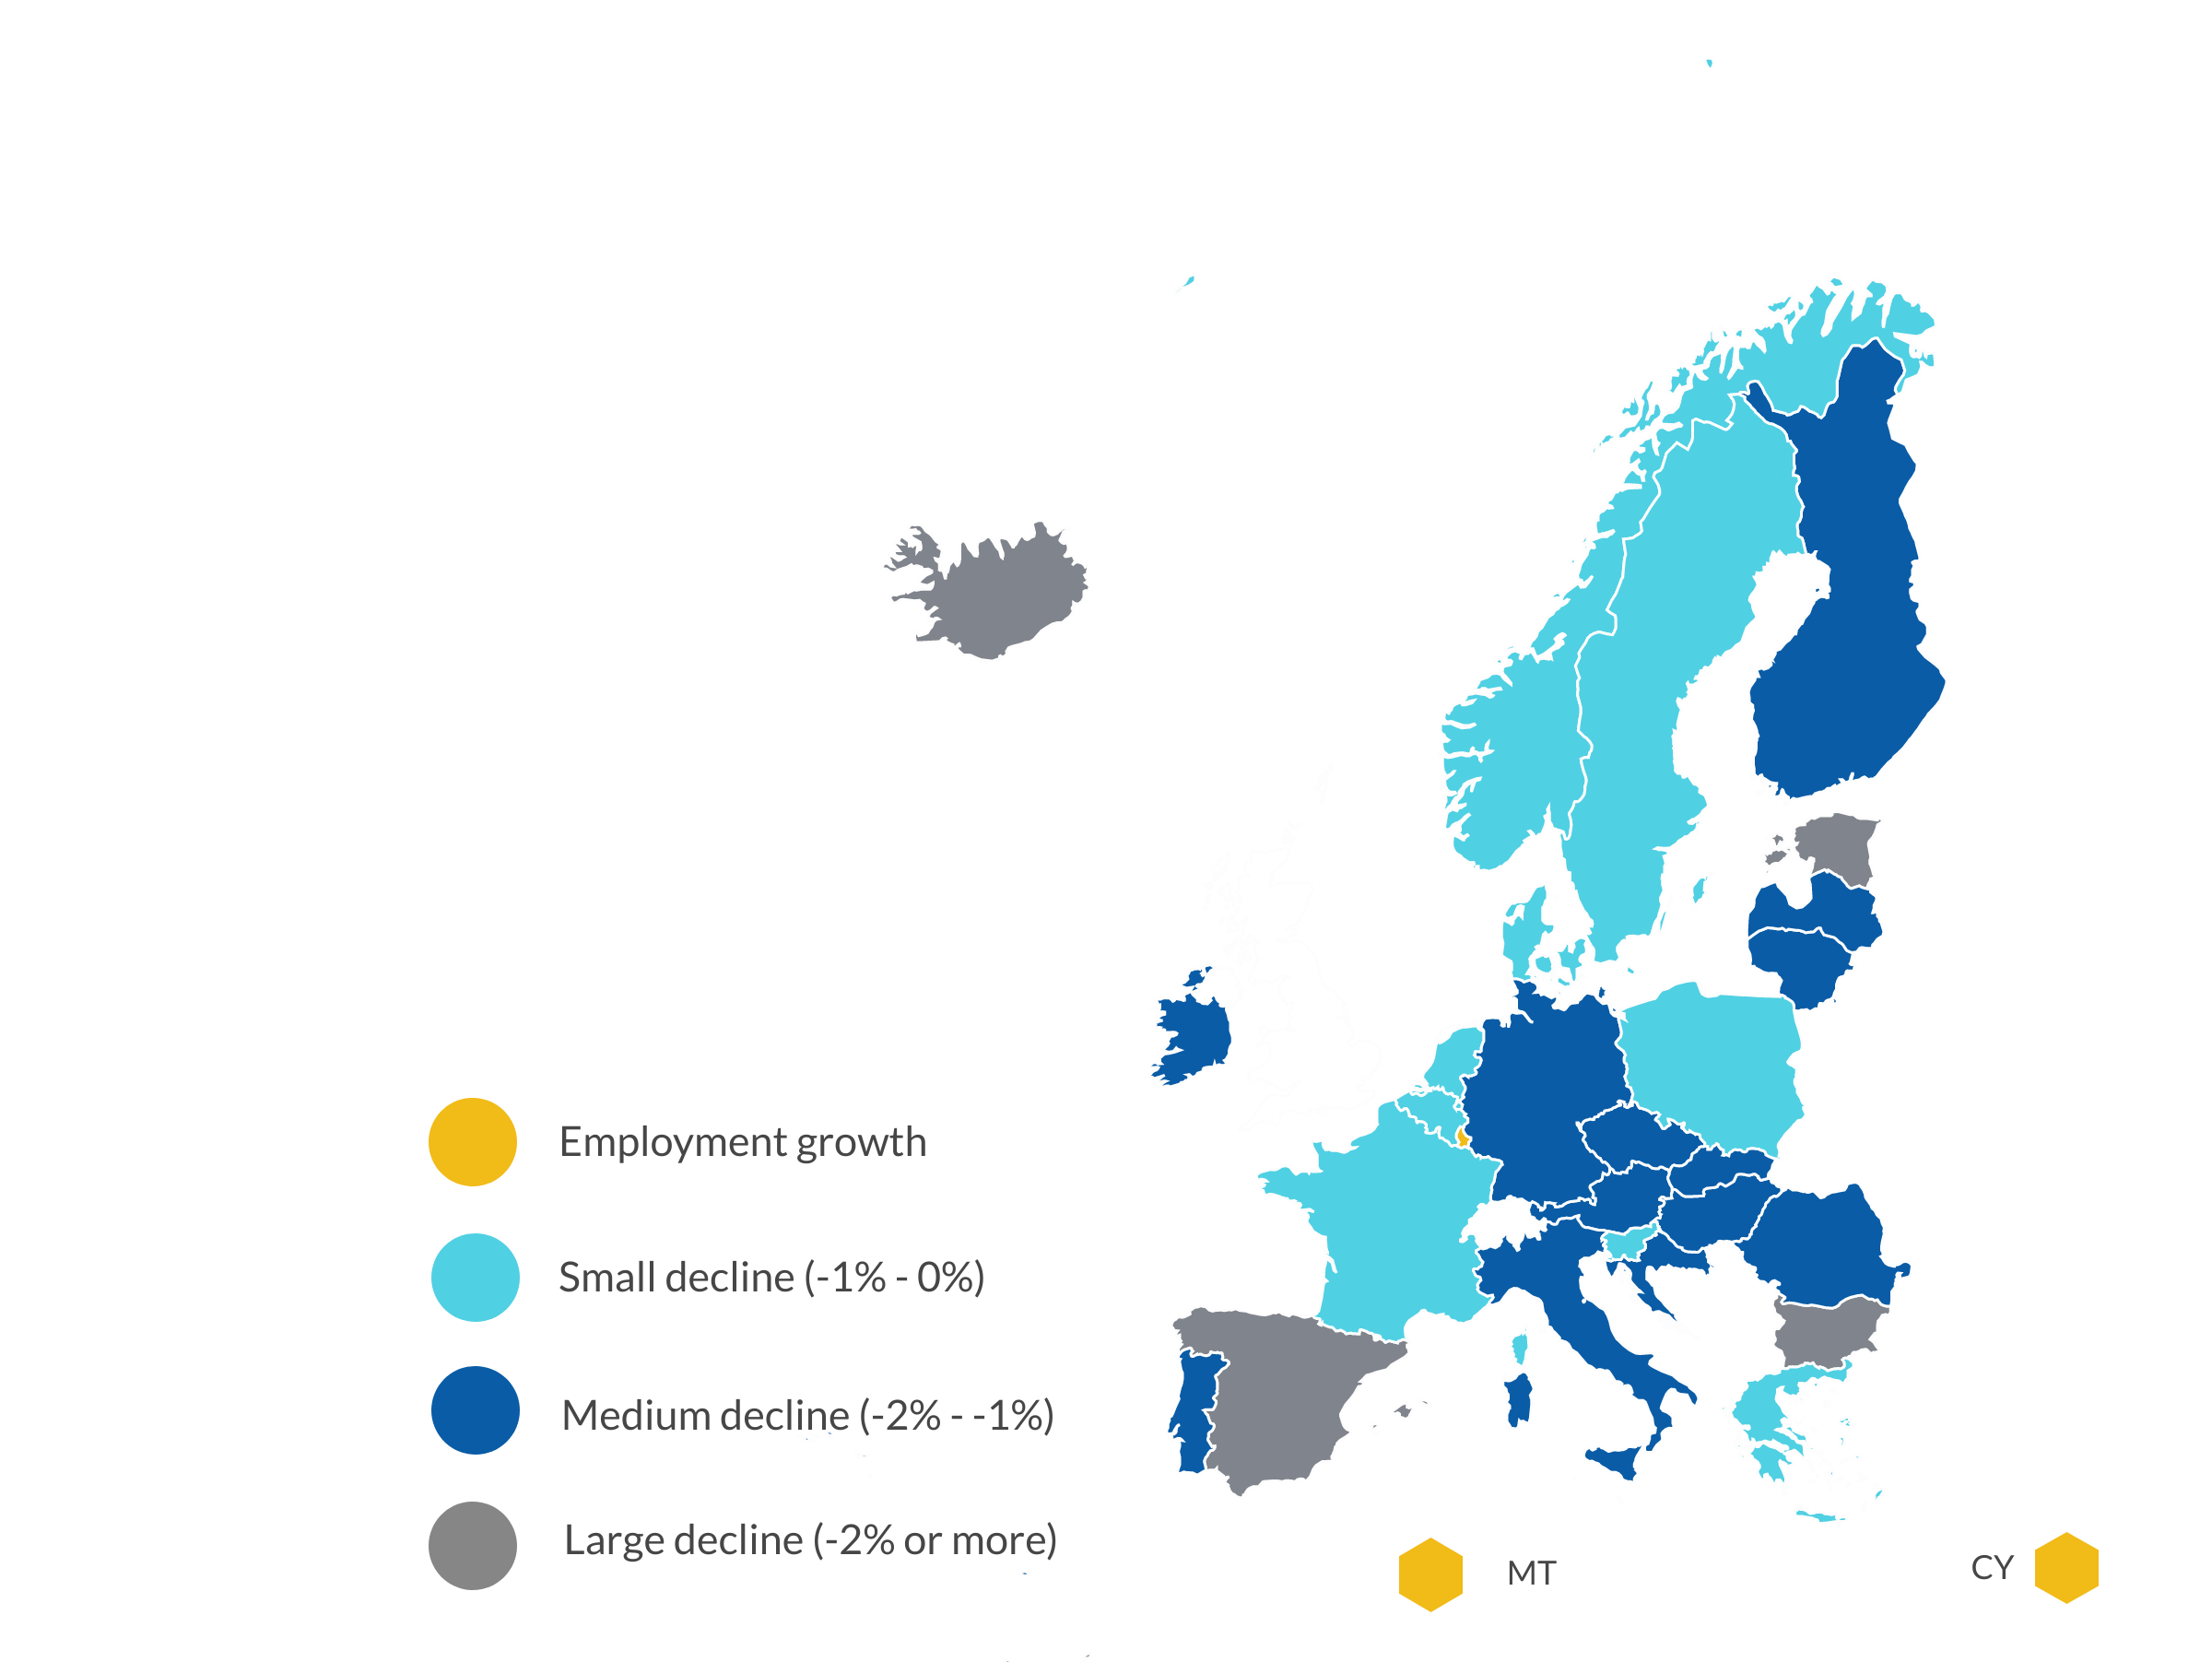
Source: Skills intelligence indicators based on EU LFS data. Own calculations.
Sectoral trends
Accommodation & food, administrative services, and construction were amongst the hardest hit sectors in 2020. Job growth in ICT services, energy supply services and public sector & defense helped offset some of the employment losses elsewhere.
As quarterly Labour Force Survey data for 2021 is available up to Q3 2021, we can already assess how sectoral employment developed in the second year of the pandemic. ICT services again appear to be the sector with the strongest employment growth. Employment was also growing in energy supply services, education, and health & social care. On the other hand, the Covid-19 pandemic continued to drive further employment losses in the accommodation & food sector and appears to have accelerated job losses in the agriculture or arts & recreation sectors in 2021(see Figure 3).
Figure 3: Employment change in the EU by sectors (2019-2020 and projection for 2021, in %)
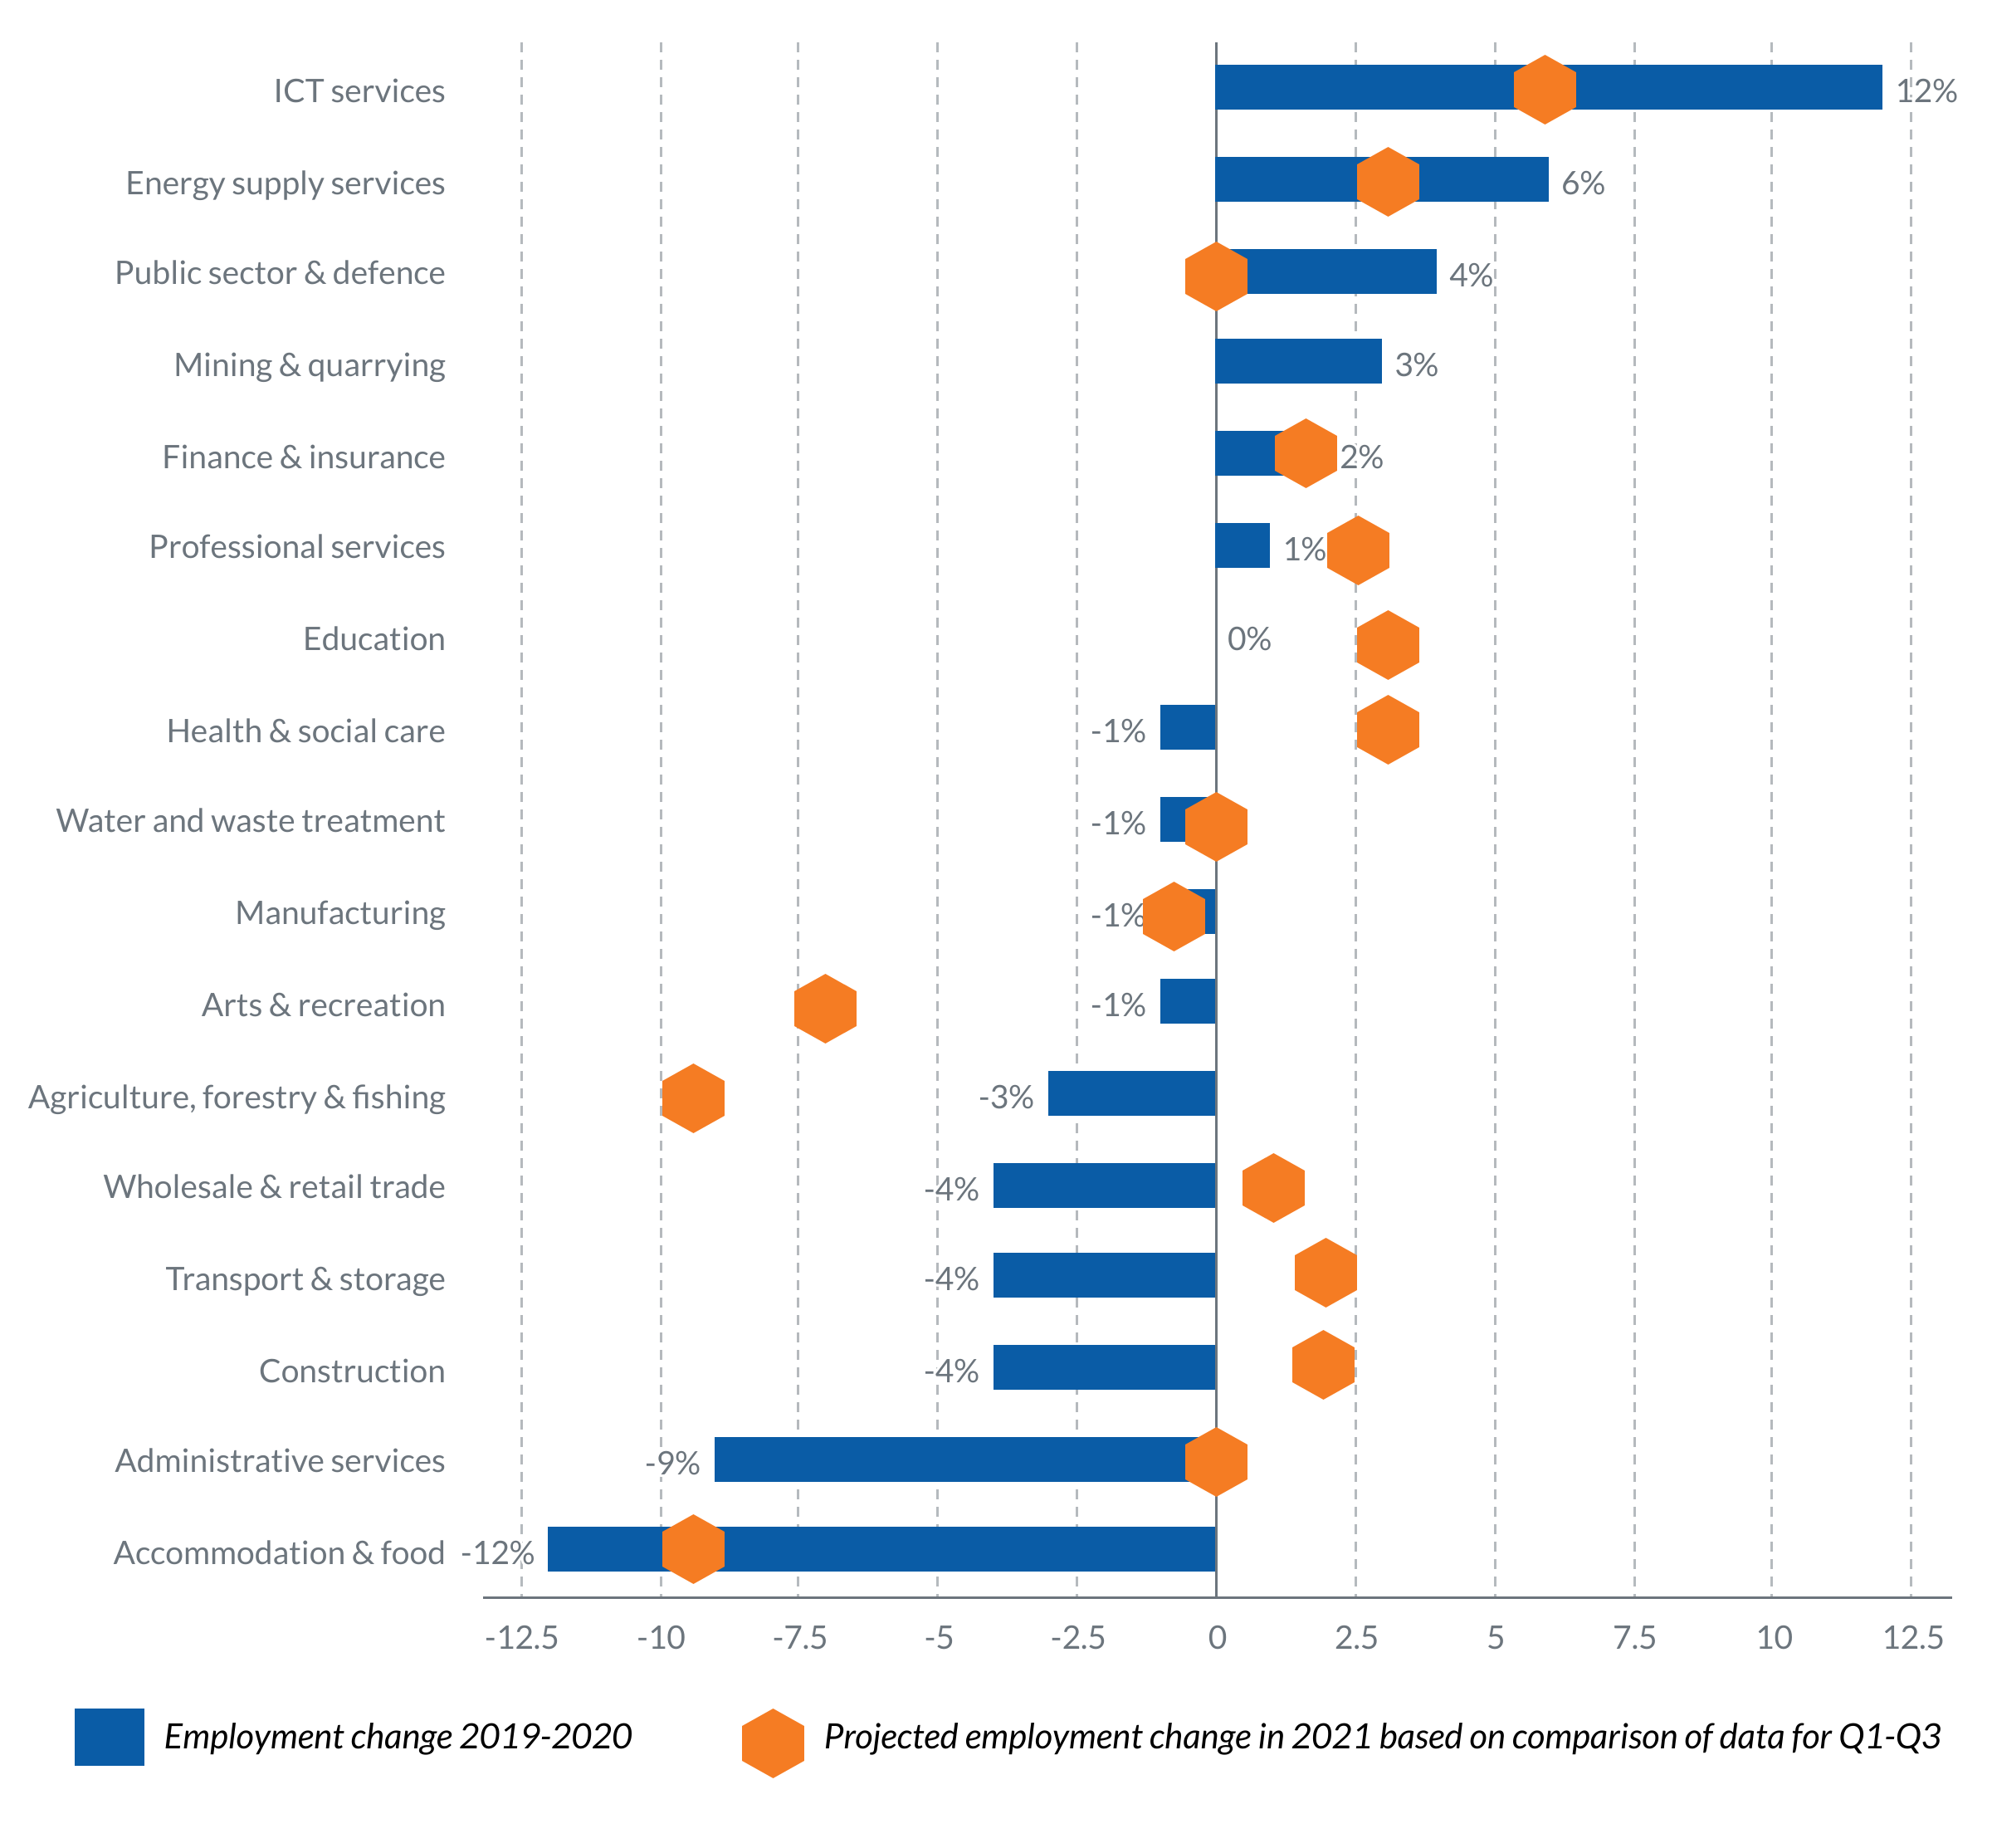
Source: Skills intelligence indicators based on EU LFS data and LFS main indicators. Own calculations.
The degree of teleworkability clearly separates growing and declining sectors, a finding that has been confirmed in several studies[iv]. Sectors providing high-end or specialised services fared relatively well in the first year of the pandemic, while jobs were lost in construction and manufacturing, albeit less than initially feared. Most jobs were lost in less skills intensive services which rely heavily on direct contact with customers or clients, such as accommodation & food, trade, and administrative services (mostly rental, leasing, employment services and travel agencies).
The share of so called “high-tech occupations” in sectoral employment can be considered a proxy for technological advancement. The most technologically advanced sectors overcame the Covid crisis 2020 best, while the least technology intensive sectors lost most jobs (Figure 4).
Figure 4: Technological advancement and employment change by sector
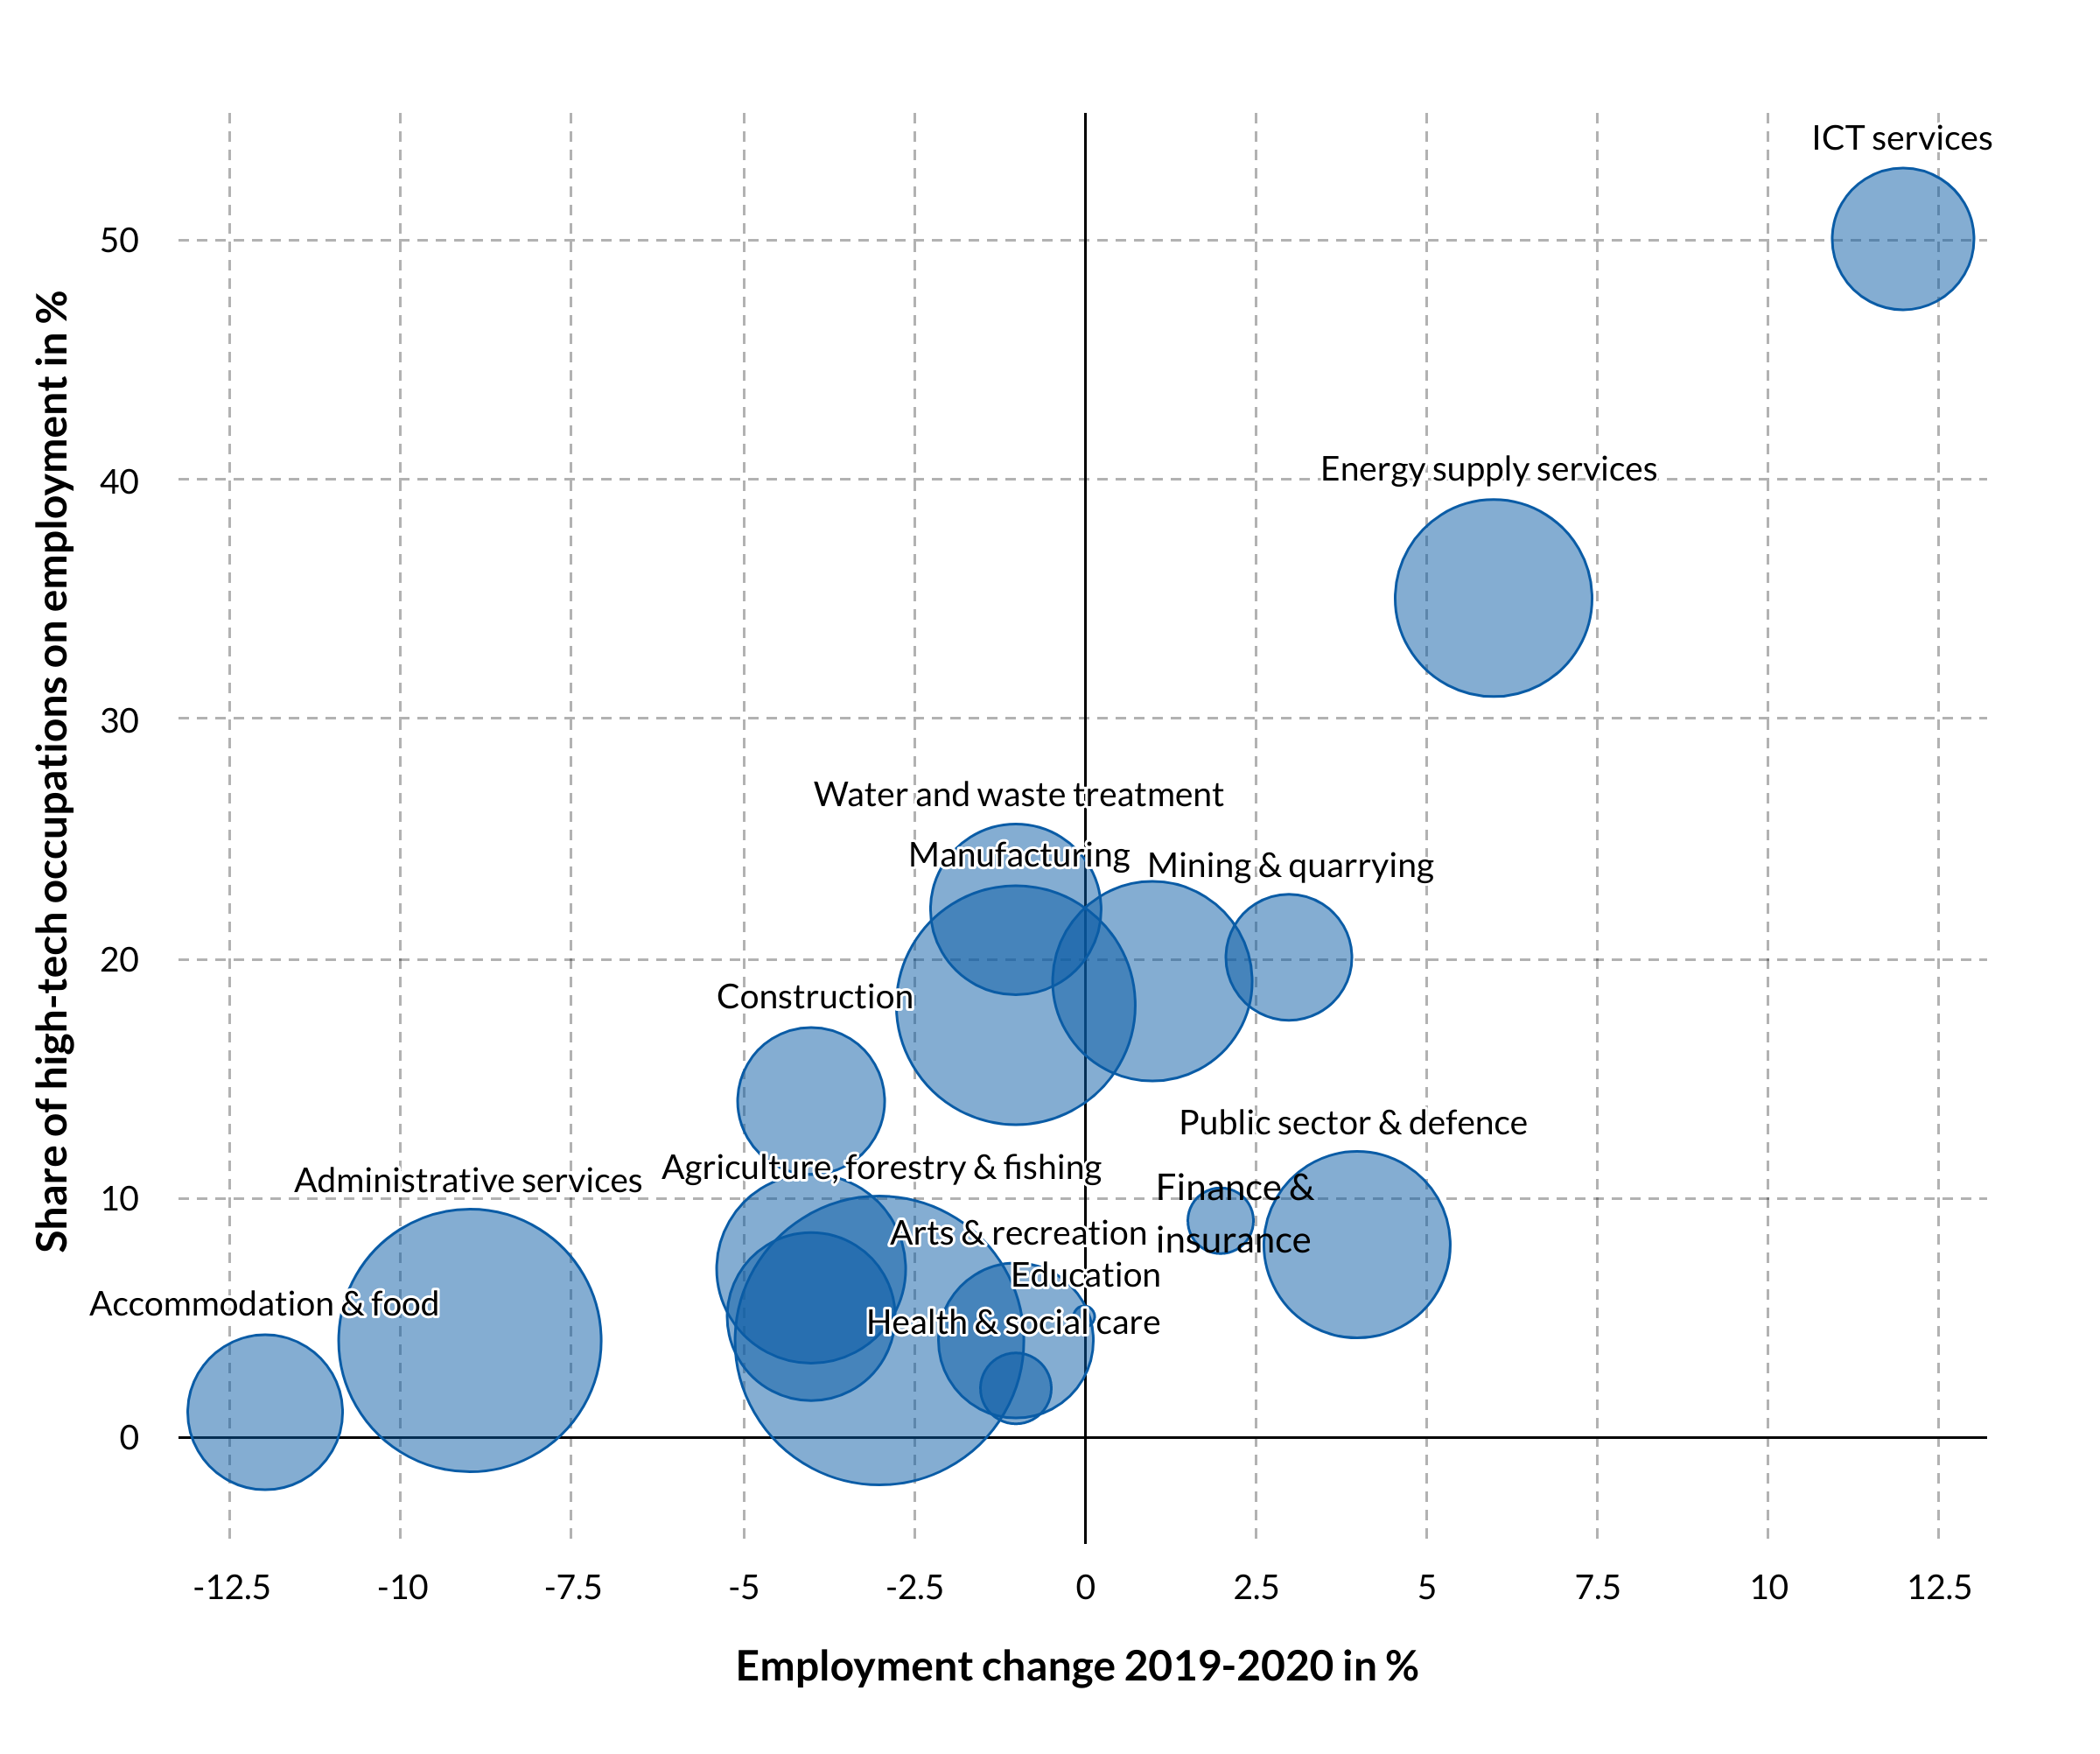
Source: Skills intelligence indicators based on EU LFS data and Cedefop Skills forecast data. Own calculations. Note: Size of a circle indicates total employment size of the sector.
Did the Covid-19 pandemic accelerate digitalization? Looking at trends in the share of ICT jobs in total sectoral employment helps shed some light on this issue from a labour market perspective.
More than one-half of ICT specialists (professionals – ISCO 25, and technicians – ISCO 35) is employed in the ICT sector itself. One in ten works in manufacturing, while the share of ICT employment in other sectors is 5% or less.
Between 2019 and 2020, the total employment of ICT specialists increased by 10%. Employment growth was unevenly distributed across sectors with health and social care gaining the most (+35%). Construction, ICT services, public sector & defense, finance & insurance, and arts & recreation follow with ICT specialist employment growing between 10 and 16%. (Figure 5)
Figure 5: ICT and overall employment change across sectors (in %)
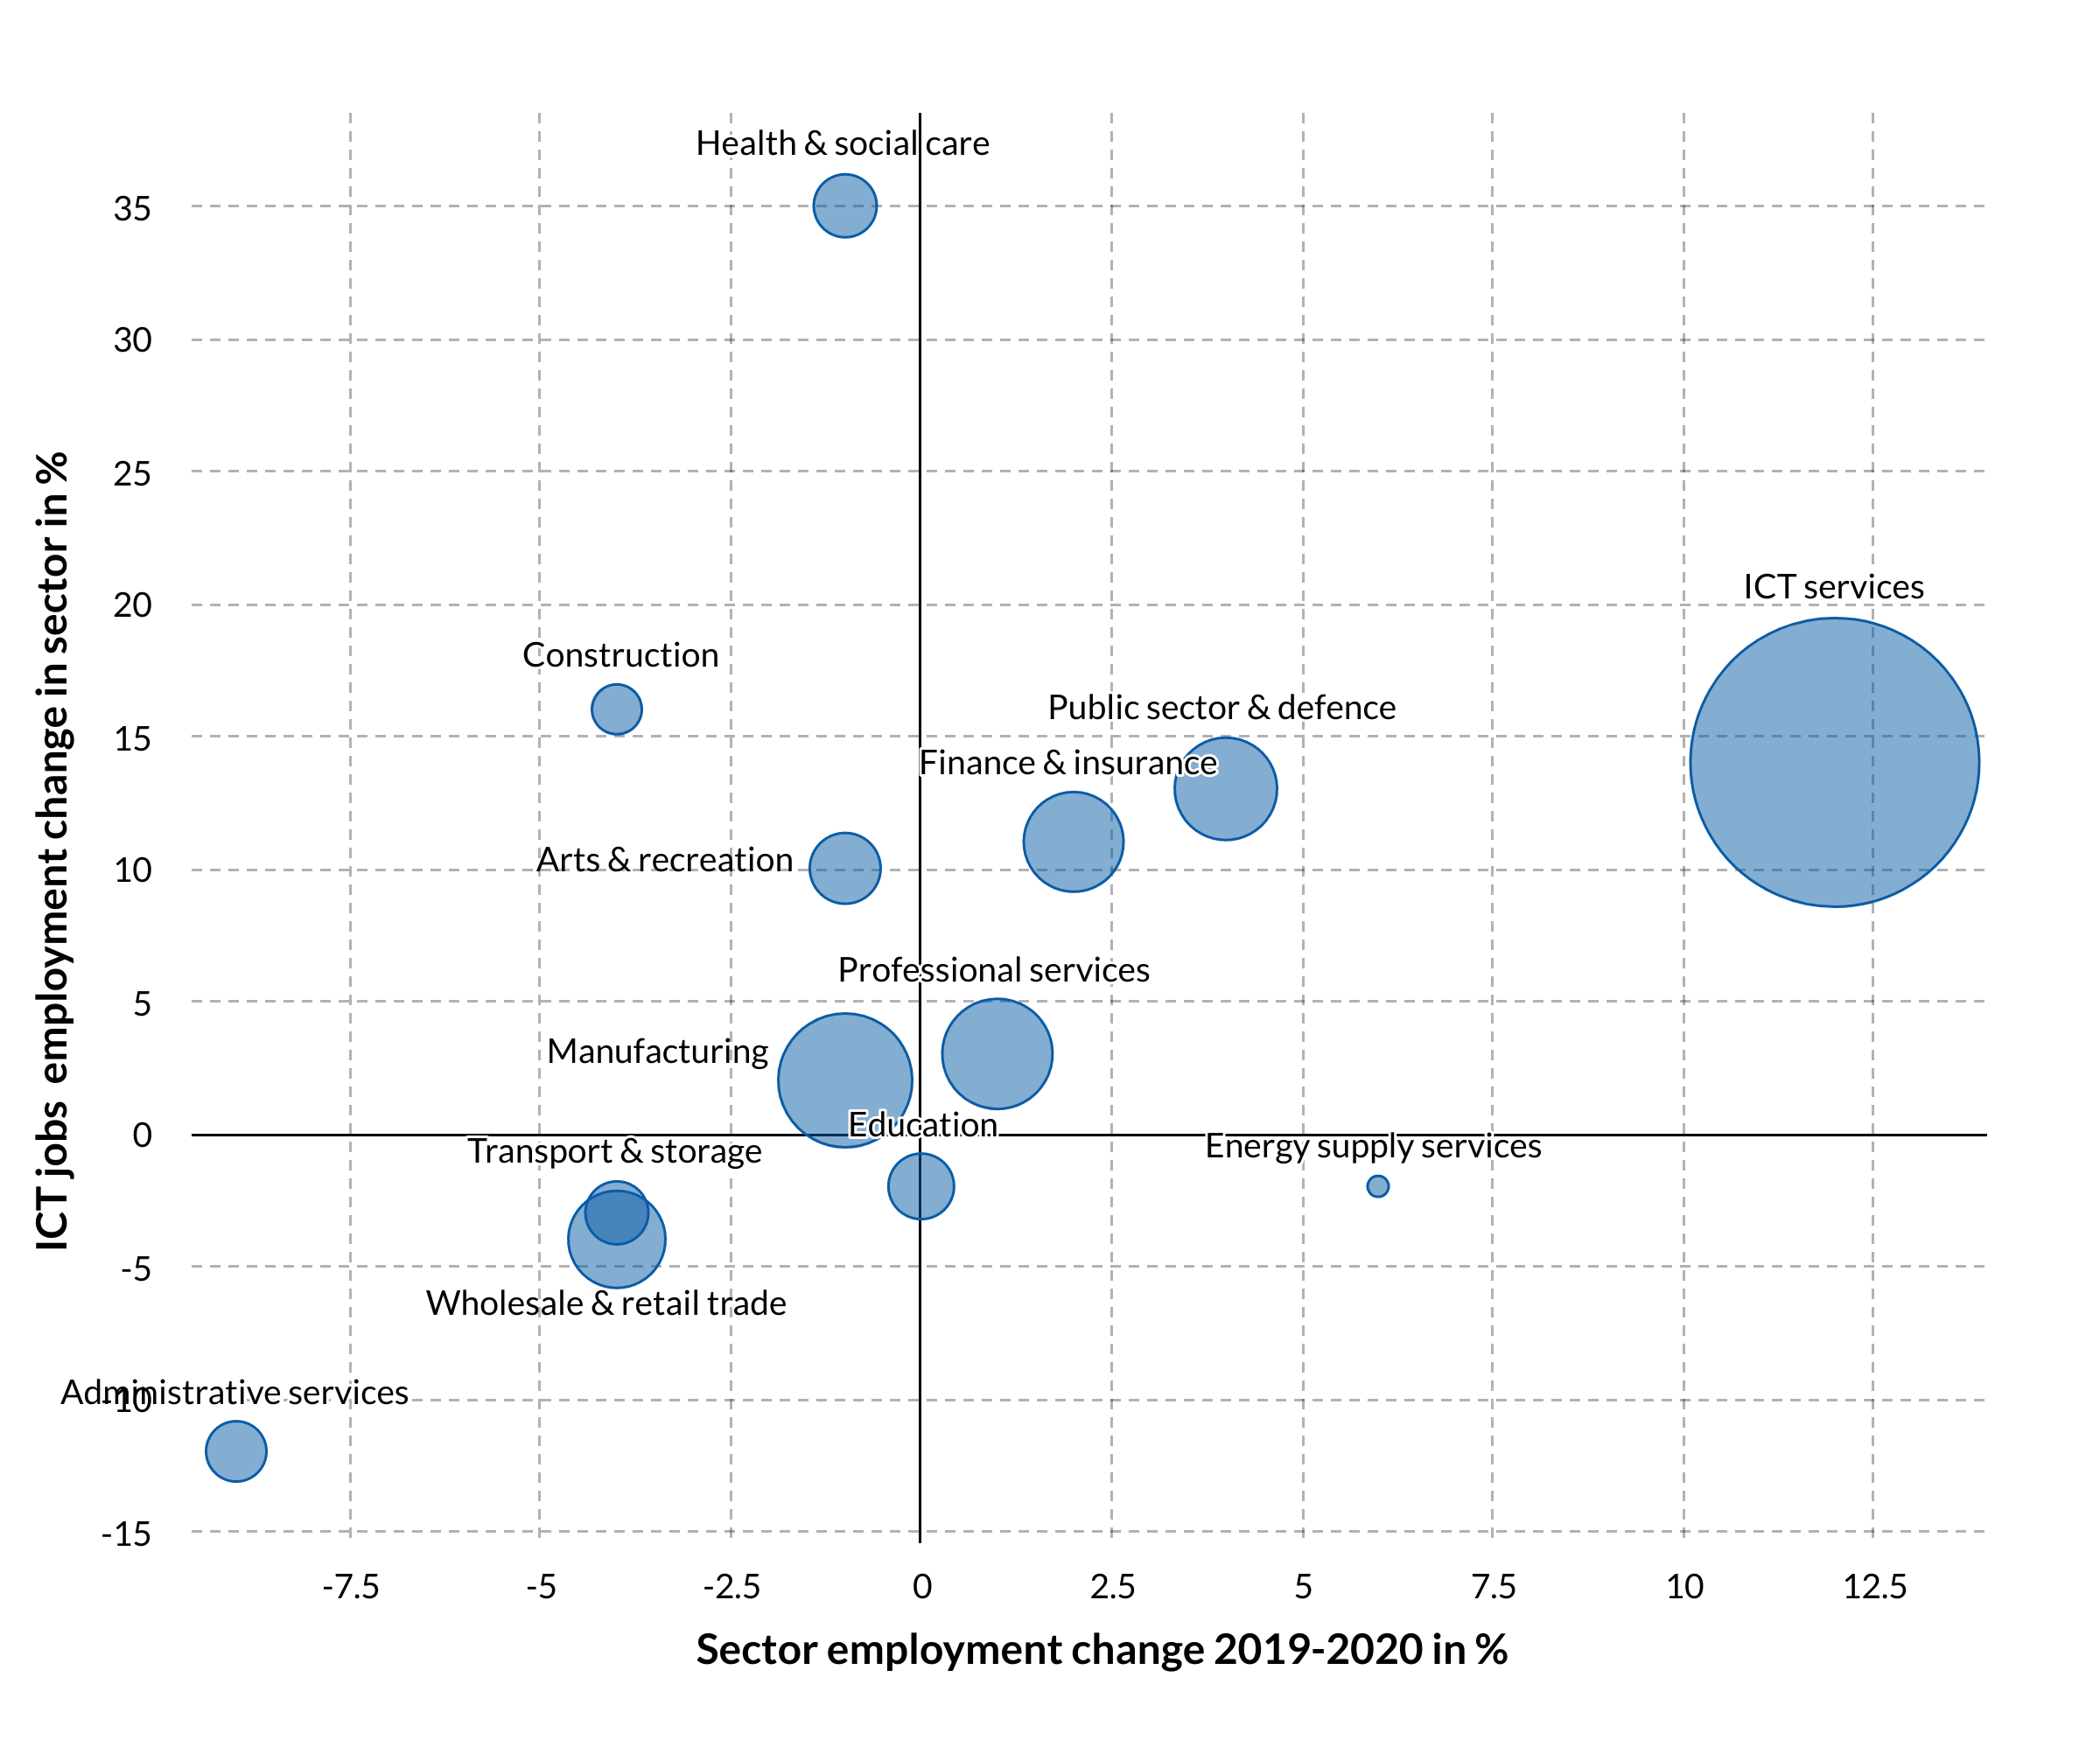
Source: Skills intelligence indicators based on EU LFS data. Own calculations. Note: Size of a circle indicates the total ICT employment size of the sector. Because of low sampling issues, the following sectors are not covered in this visualisation: accommodation & food, agriculture, forestry & fishing, mining & quarrying, and water and waste treatment.
While the correlation appears to be somewhat weaker than in Figure 4, it is still safe to conclude that sectors where ICT intensity increased (meaning that the share of ICT jobs in sector employment grew) were more resilient to the impact of the pandemic and they lost fewer jobs overall.
This is not to say that ICT is a universal remedy: while it certainly contributes to protecting jobs and keeping organizations running, it cannot be deployed everywhere to the same extent and there are practical and financial limitations to how it can be used.
Trends in occupations
Occupational level trends confirm that some labour market segments were quite sensitive to the impact of the pandemic, while others proved to be relatively resilient. High skilled occupations in science and technology, but also learning, culture, and social occupations had net job growth in 2019-2020 and most occupations which are typically office-based performed better. Many jobs were lost in hospitality, sales, and personal services occupations, and employment in production and construction also sharply declined (Figure 6).
Figure 6: Employment change in main job areas (2019-2020, in thousands)
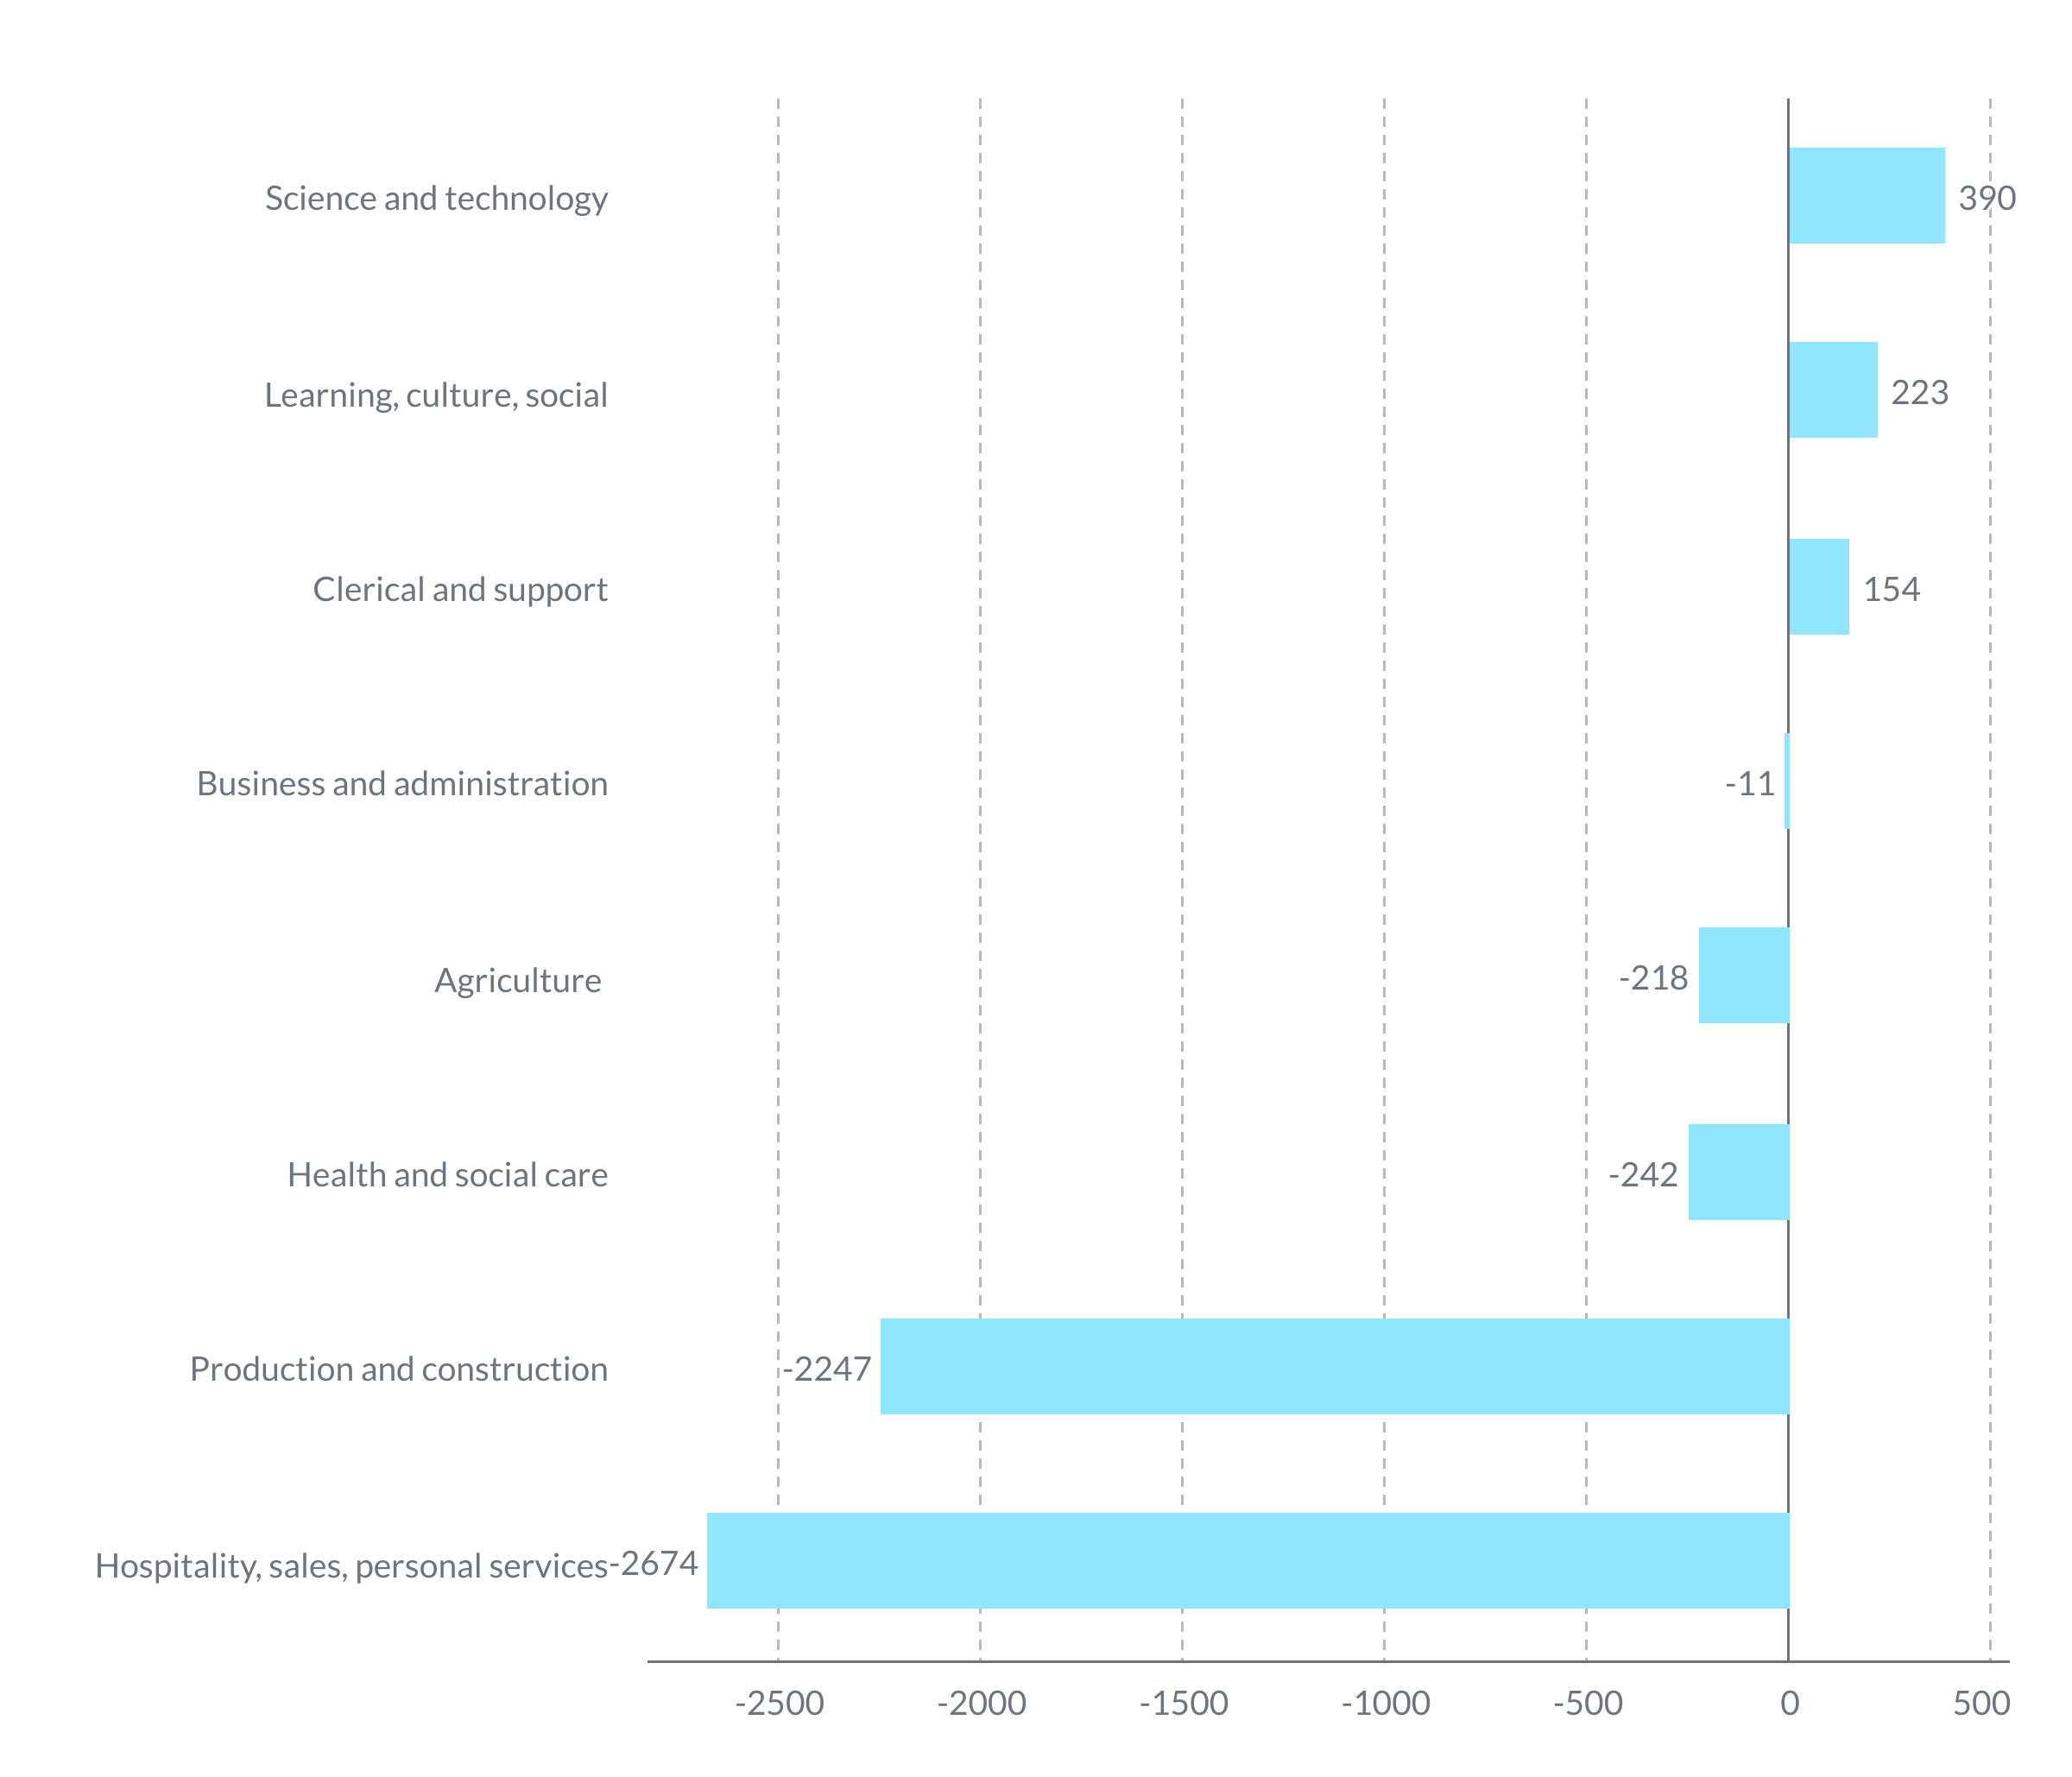
Source: Skills intelligence indicators based on EU LFS data. Own calculations.
At a more detailed occupational level, employment in 12 occupations grew between 2019 and 2020. Subsistence farmworkers – one of the smallest occupations in absolute terms - had 23% more jobs in 2020. Unsurprisingly ICT, teaching, office, health, legal and social professionals were also among the employment winners, together with researchers & engineers, and hospitality & retail managers. 27 occupation groups recorded a year-on-year decline, with employment for street services workers, legal & social associate professionals, personal services workers, accounting clerks, and cleaners & helpers being most affected (Figure 7).
Figure 7: Employment change by detailed occupation (2019-2020)
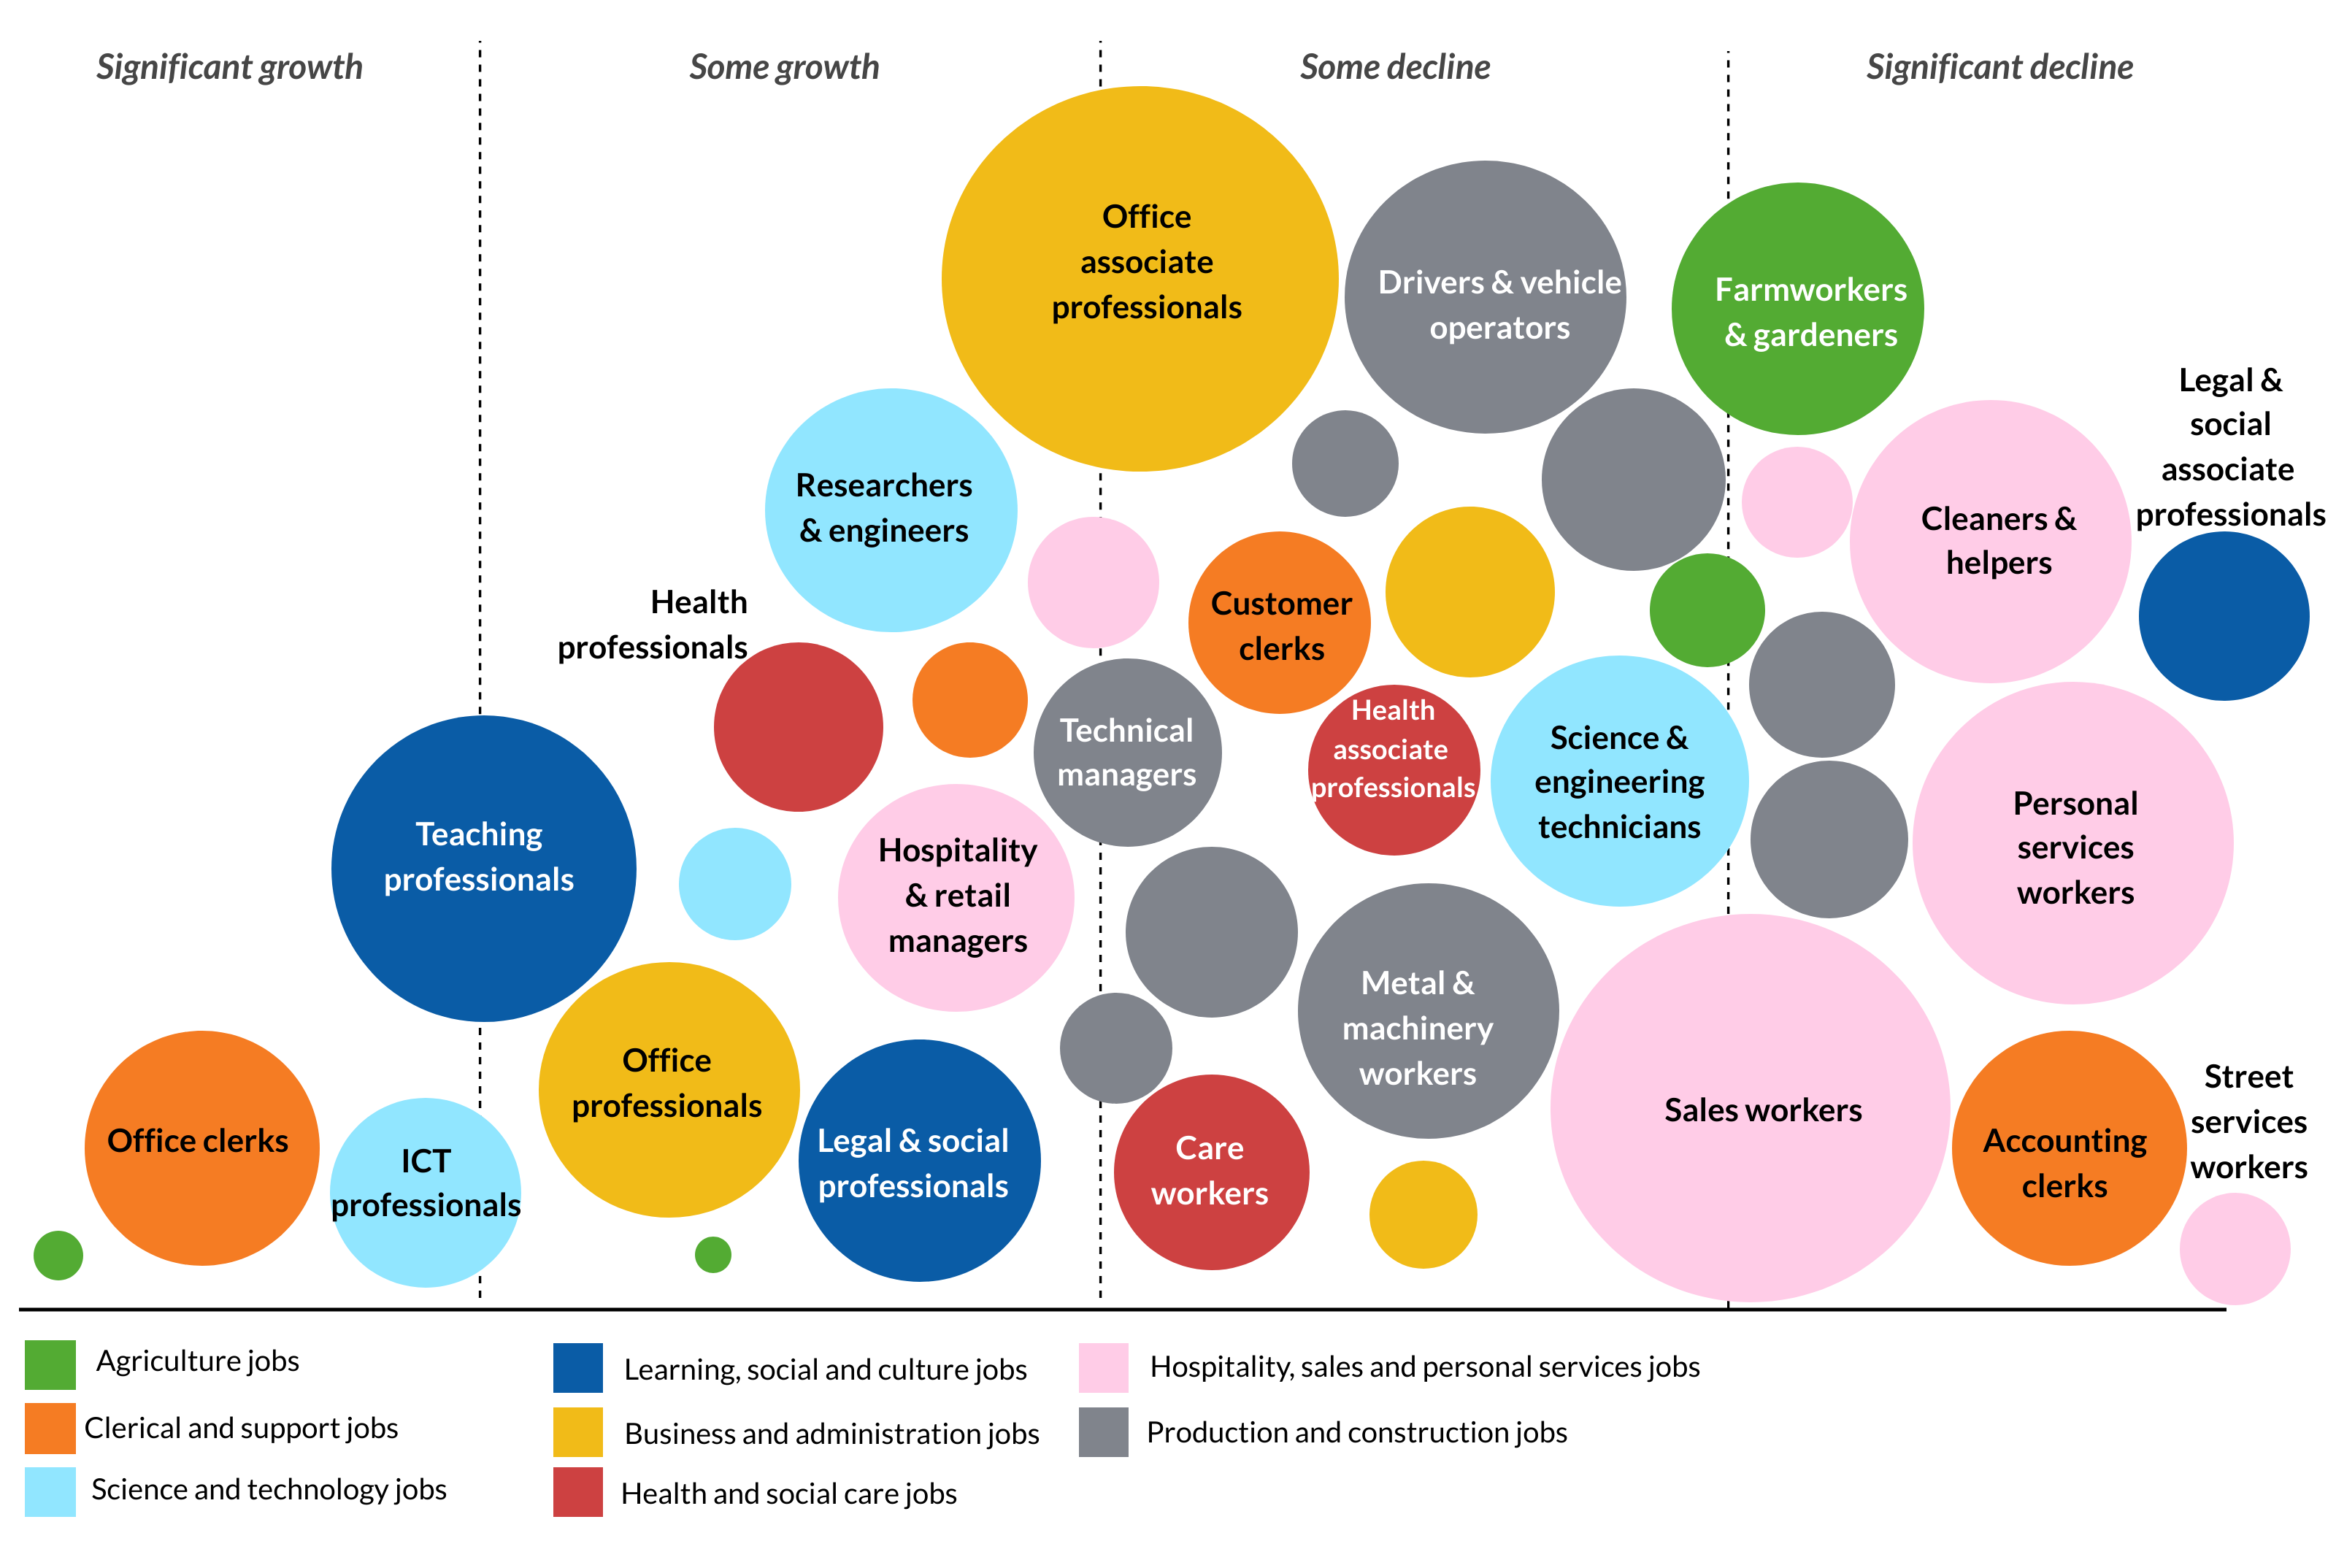
Source: Skills intelligence indicators based on EU LFS. Own calculations. Note: The size of a circle indicates total employment in the occupation.
Looking at the combination of occupational and sectoral trends, it is obvious that total job losses in the manufacturing and construction sectors (Figure 3) amounted to less than half of the employment decline in production and construction occupations (Figure 6). The available data can be used to understand how Covid-19 accelerated shifts in the manufacturing sector (Box 1).
Box 1: Employment trends in manufacturing
The gradual shift towards relying more on technology and increasing productivity via automation and digitalisation has been shaping the manufacturing sector for decades. Covid-19 may accelerate such trends, providing another strong incentive for production that depends less on the physical presence of many manufacturing workers. Between 2019 and 2020, there was indeed a sharp employment decline in manufacturing, which was almost entirely driven by job losses among production line workers (Figure 8).
Figure 8: Employment change by occupation in the manufacturing sector (2019-2020, in thousands)
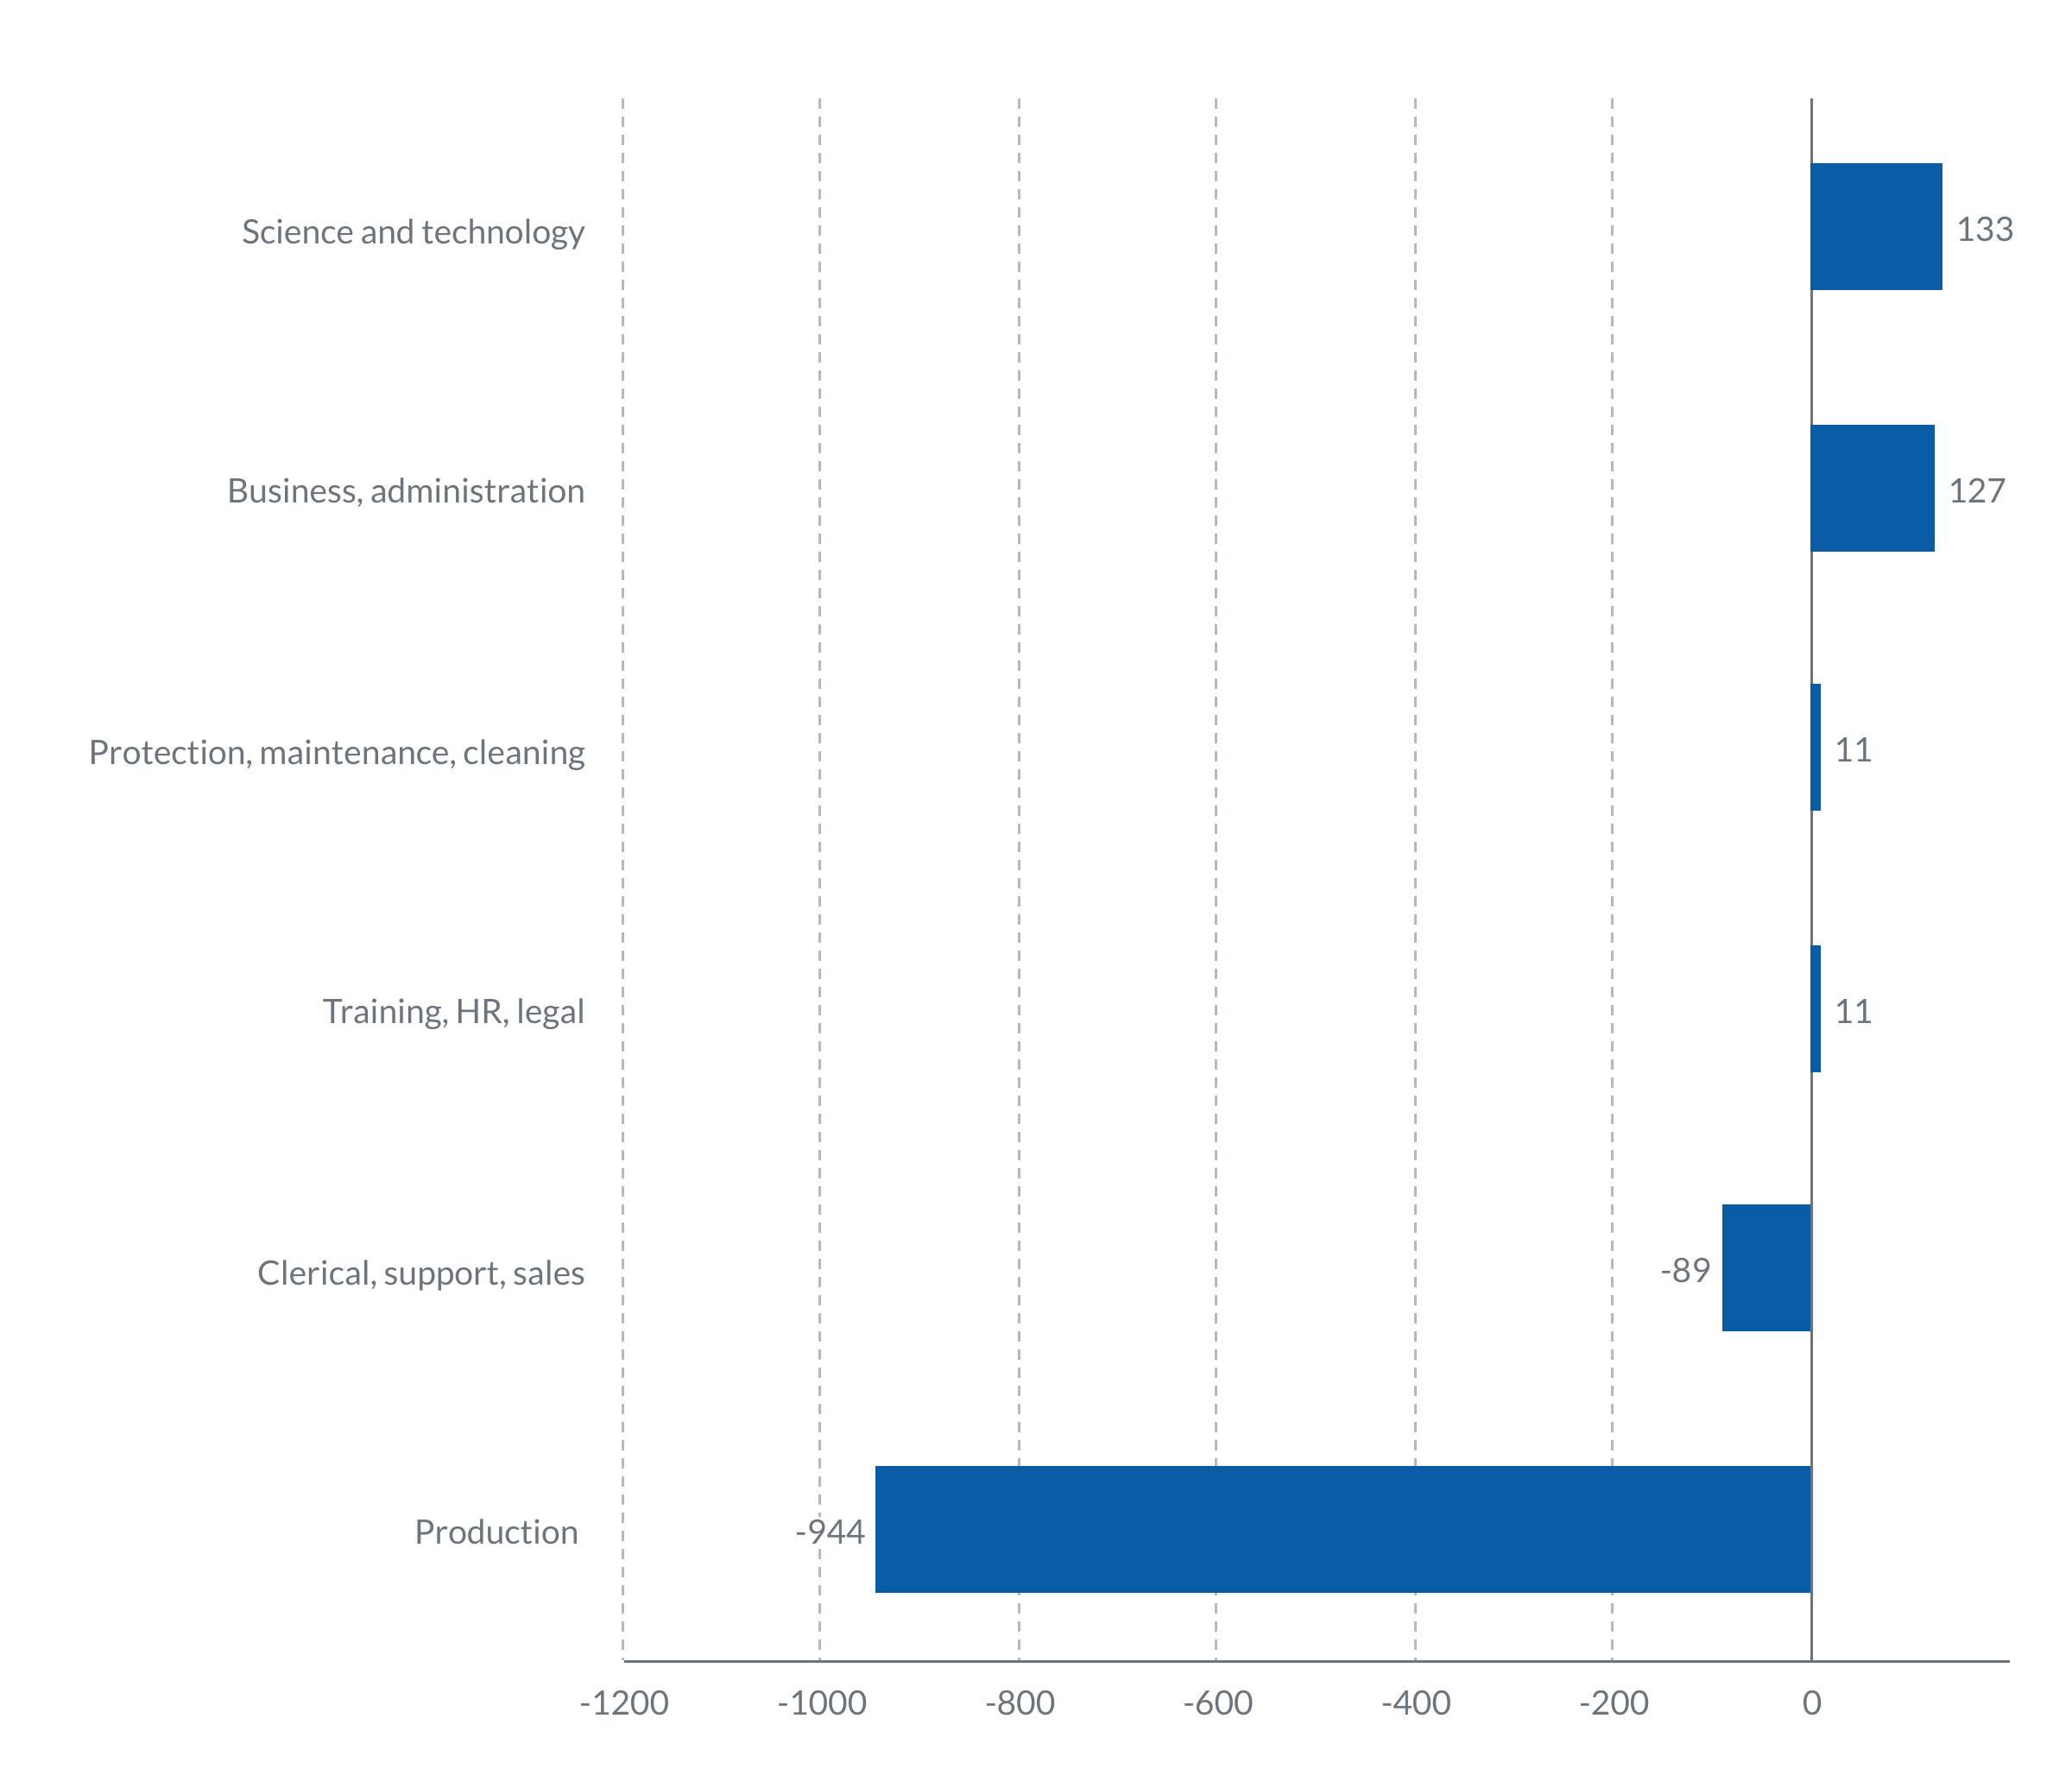
Source: Skills intelligence indicators based on EU LFS data. Own calculations.
However, the total employment loss in the sector was much lower than the almost 1 million jobs lost in production occupations. Growing employment in science and technology – occupations central to implementing automation and research and development – and business administration area partly compensated for the occupational employment losses at the medium and lower end of the skills spectrum. This means that alongside shrinking employment, the sector also experienced significant skills upgrading.
Labour market trends: What's next?
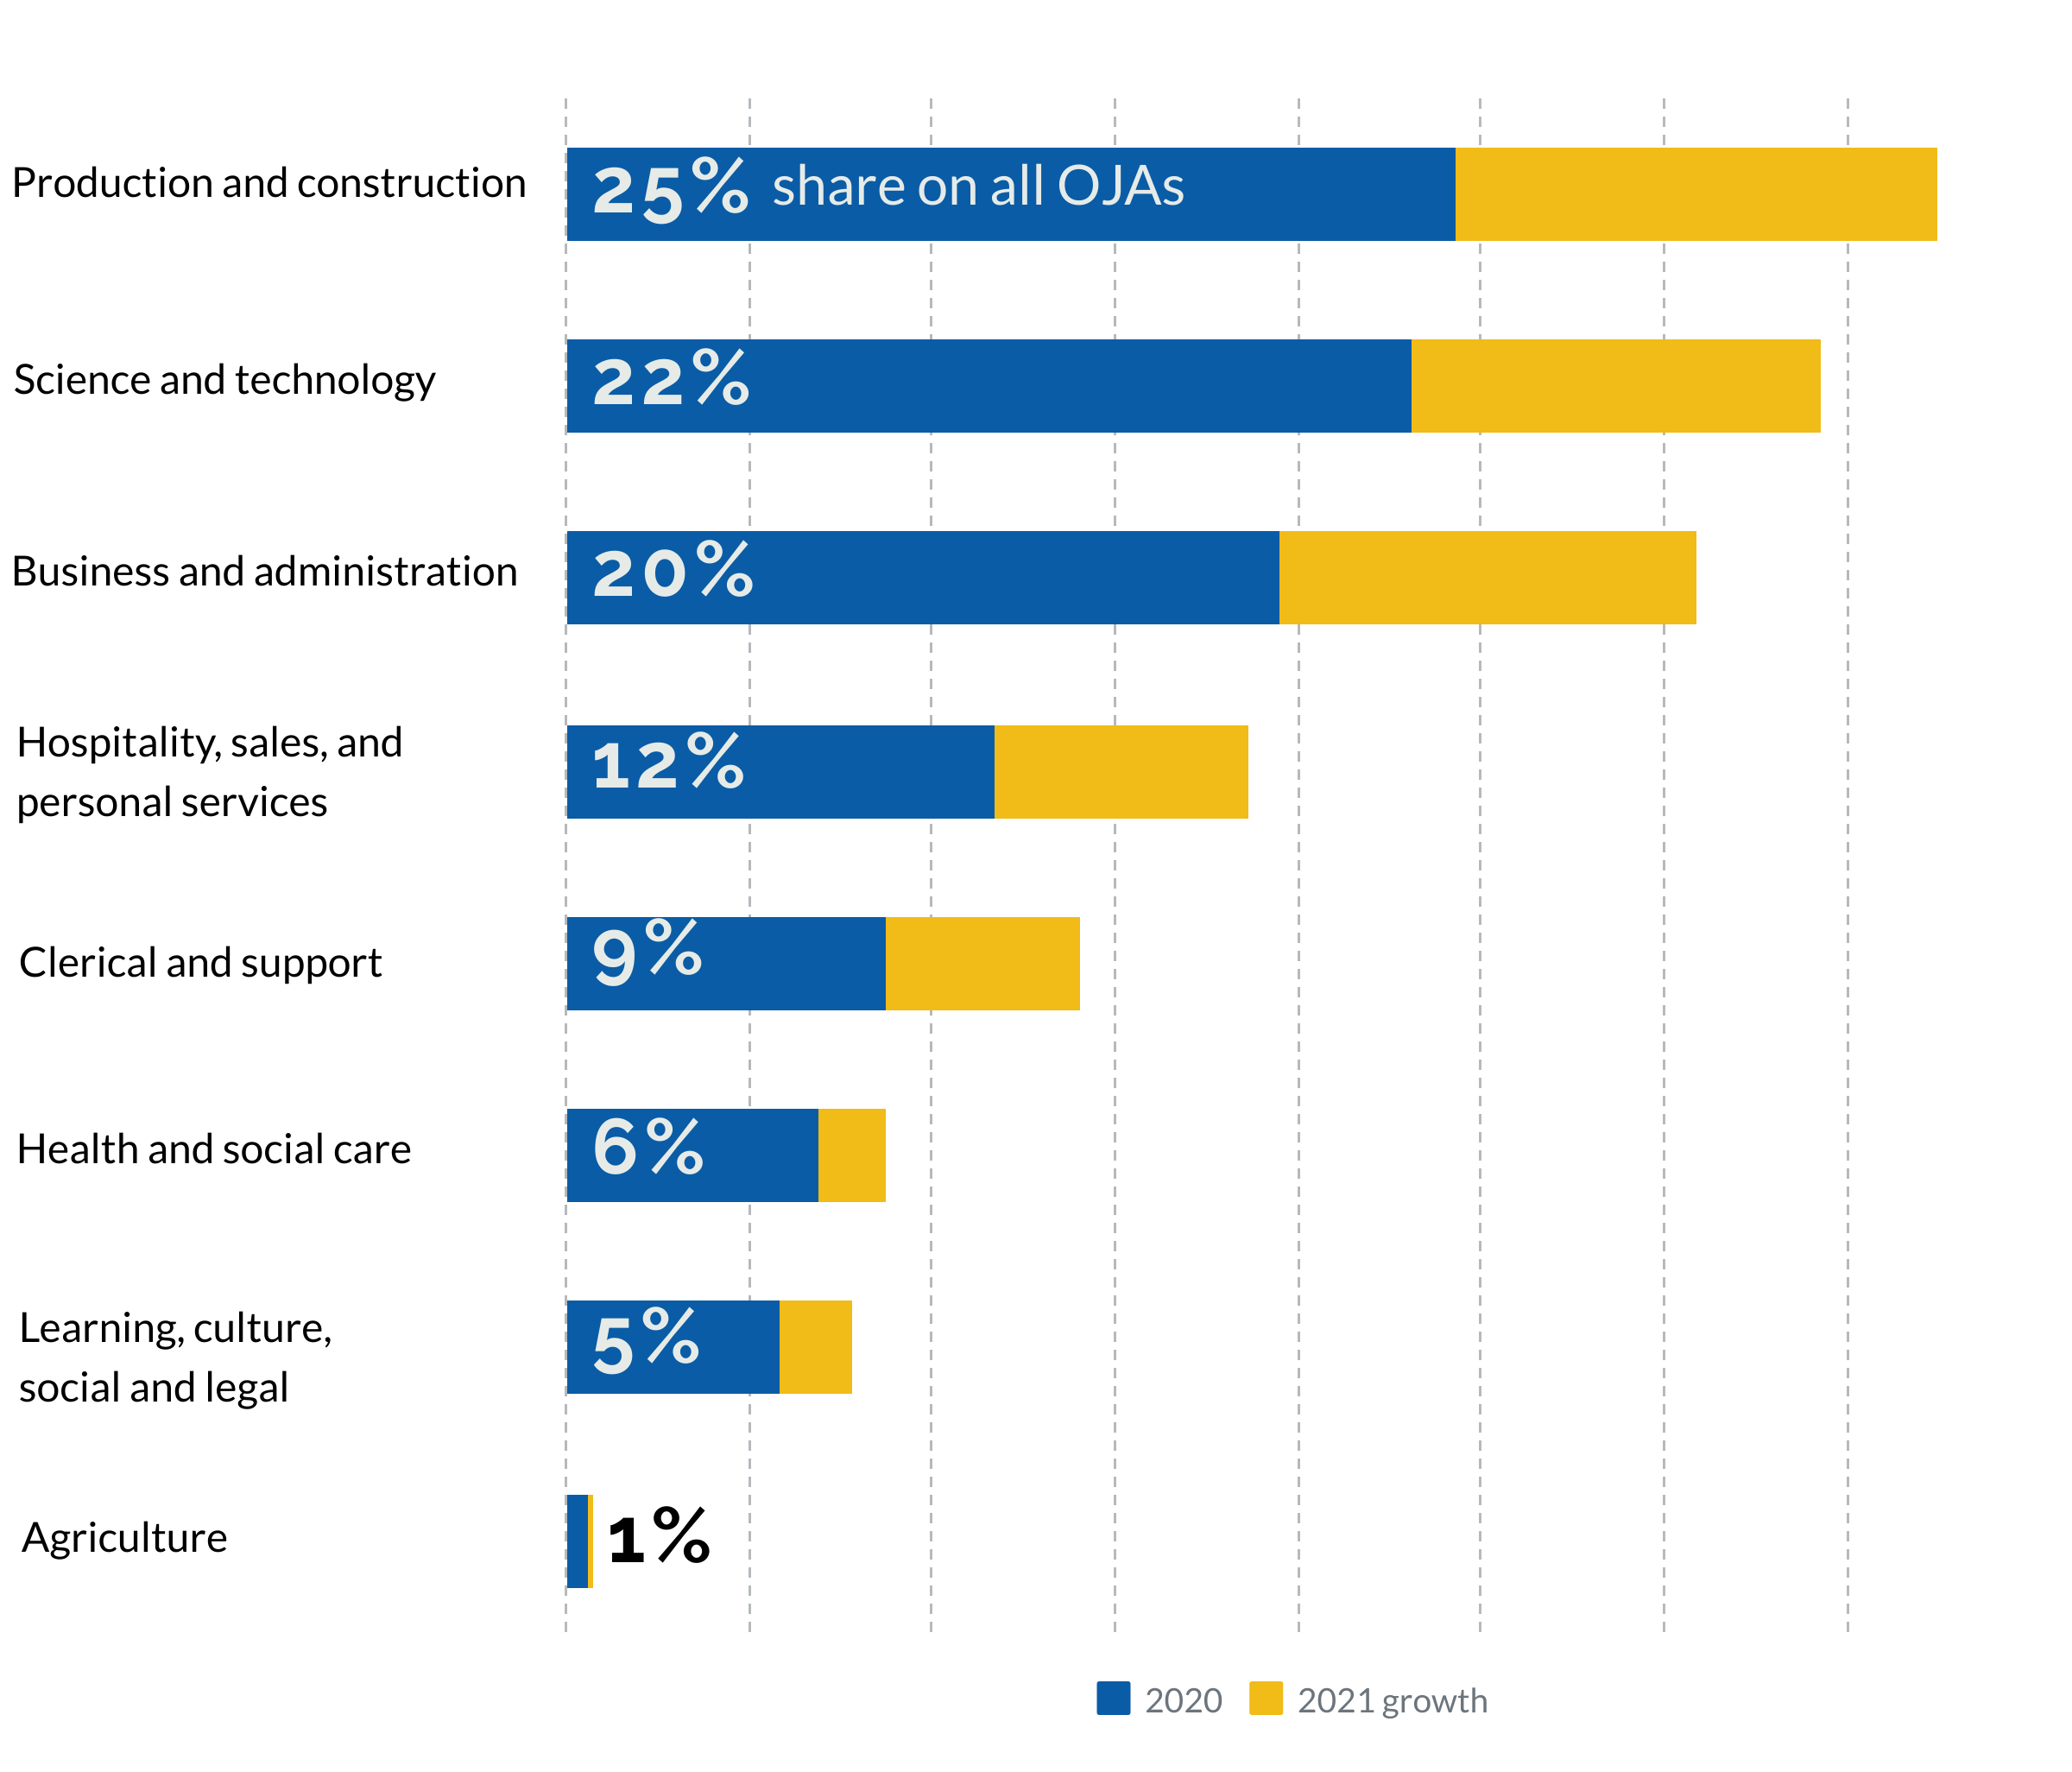
Alongside estimates of possible employment developments based on quarterly employment data (see Figure 3) Cedefop’s Skills-OVATE analysis of online job advertisements brings up-to-date information that can be used for reflecting on labour market trends. It suggests recovery and transitions are already rapidly progressing. For most main job families used in the preceding occupational analysis, OJAs in 2021 were up by 50% or more compared to 2020 (figure 9). While not every OJA leads to a successful hire, such signals nevertheless show that the European job market is back on track, reversing 2020 job losses and with job creation that has the potential to bring unemployment back to pre-pandemic levels.
Figure 9: Structure and change in posted OJAs in 2021 by major job families (compared to 2020, in %)
Source: Cedefop Skills OVATE. Own calculations.